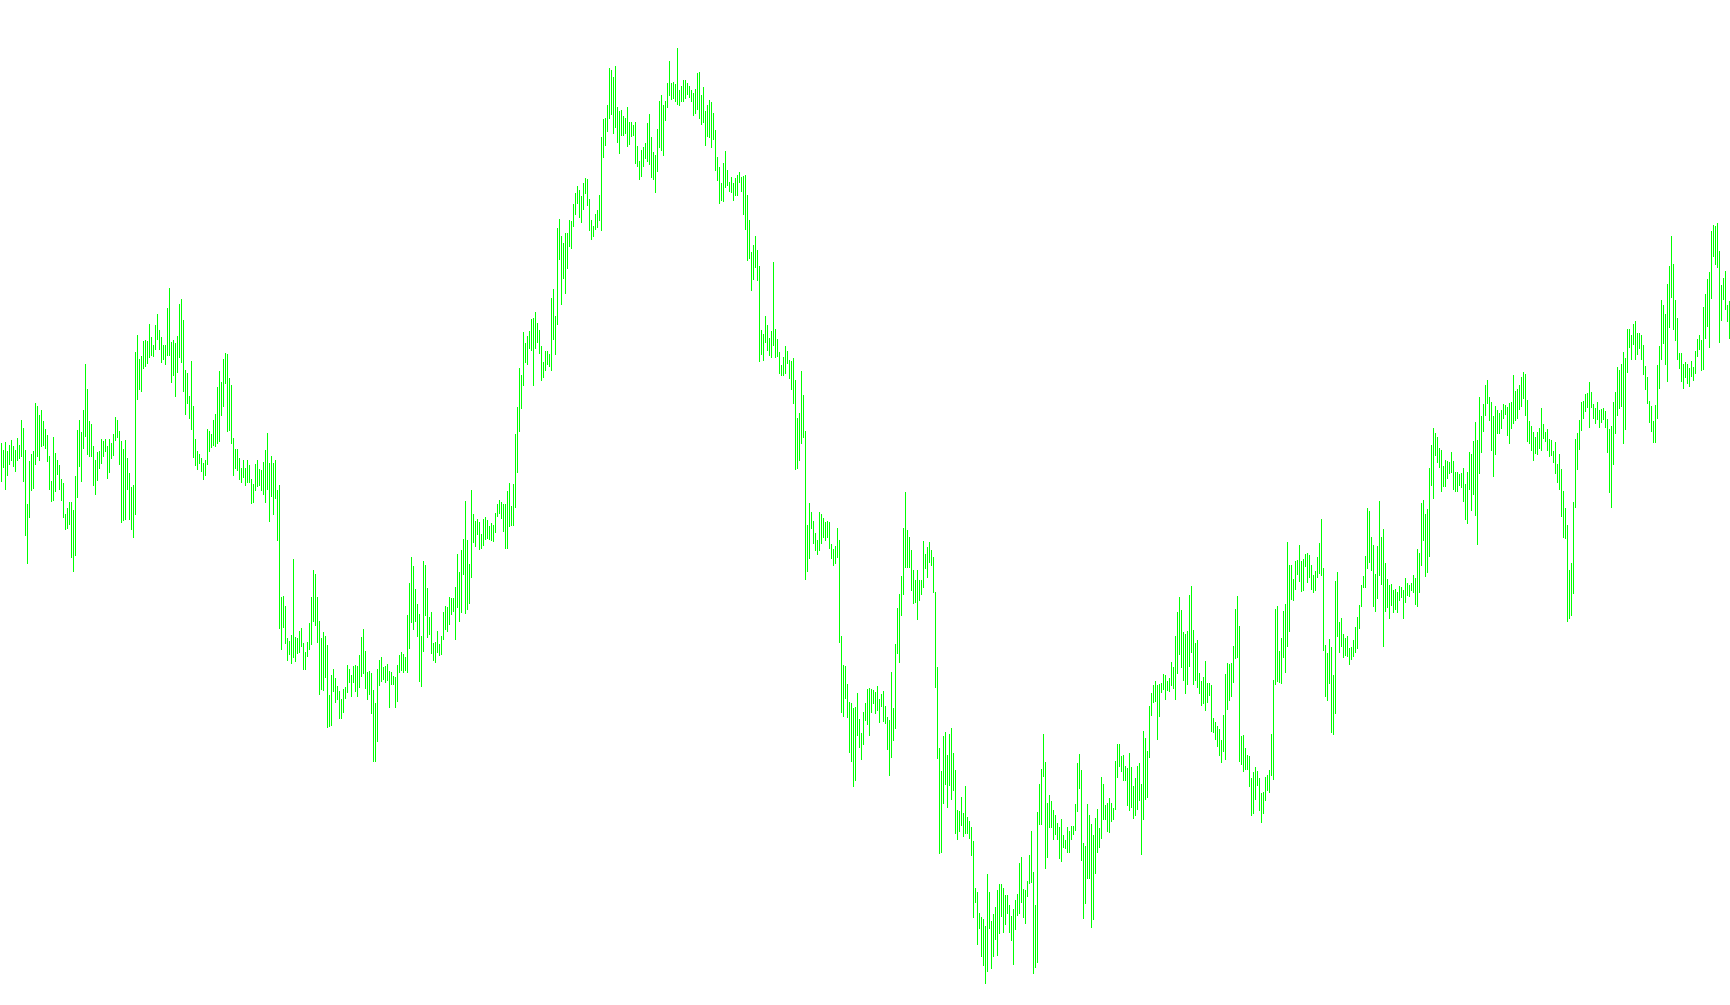
The BBWin indicator is a specialized technical analysis tool designed to provide traders with a clear visual representation of market momentum, price volatility, and trend direction in a dedicated sub-window. Unlike standard indicators that overlay directly on the price chart, this tool isolates these metrics into their own space to help identify "Black & White" clarity in market movements.
Core Operational Logic
The script functions by calculating several layers of moving averages and Bollinger Band deviations simultaneously to interpret how the current price relates to historical averages. Here is a breakdown of the logic:
1. Trend Identification (Moving Average Difference) The indicator begins by comparing two different timeframes of simple moving averages (one short-term and one long-term). By calculating the difference between these two, it establishes a baseline for the current trend. This helps differentiate whether the market is in a steady climb, a decline, or a period of consolidation.
2. Price Position Analysis The tool allows the user to choose specific price points (such as Open, High, Low, Close, or a customized average) to serve as the primary data source. It then compares these prices against moving averages to determine "relative position." Essentially, it answers: Is the current price trading above or below its recent historical average?
3. Dynamic Volatility Measurement The script utilizes Bollinger Bands—a common volatility indicator—but applies them in a unique way. It calculates the distance between the price and the upper/lower bands. Depending on whether the price is currently above or below the moving average, the logic shifts:
- Bullish Context: If the price is above the average, it focuses on the distance to the upper bands.
- Bearish Context: If the price is below the average, it switches focus to the lower bands.
4. Visual Representation & Outputs The logic translates these mathematical calculations into seven distinct visual elements:
- Trend Lines: Clear indicators showing the overarching direction of the market.
- Directional Markers: Visual cues that change based on whether the price momentum is pushing upward or downward.
- Histogram Components: These represent specific "gaps" or deviations, providing a more granular look at how aggressively the price is moving away from its mean.
Summary for Traders
In practical terms, this script filters out market noise to highlight the relationship between price and volatility. It tells you not just where the price is, but how strongly it is moving in a specific direction relative to its historical behavior. By isolating these trends into a separate window, it allows for a cleaner interpretation of market "health" without cluttering the main price action chart.
//+------------------------------------------------------------------+
//|                                                        BBWin.mq4 |
//|                 Copyright 2014,  Roy Philips Jacobs ~ 27/07/2014 |
//|                                           http://www.gol2you.com |
//+------------------------------------------------------------------+
#property copyright "Copyright 2014,  Roy Philips Jacobs ~ 27/07/2014"
#property link      "http://www.gol2you.com ~ Forex Videos"
#property description "Forex Indicator Black & White Beauty Win ~ BBWin."
#property description "BBWin is the Bollinger Bands® indicator in the separate window with trend lines."
#property version   "1.00"
#property strict
//--
#property indicator_separate_window
#property indicator_buffers 7
#property indicator_color1 clrSnow
#property indicator_color2 clrSnow
#property indicator_color3 clrSnow
#property indicator_color4 clrSnow
#property indicator_color5 clrBlack
#property indicator_color6 clrRed
#property indicator_color7 clrLimeGreen
//--
#property indicator_width1 5
#property indicator_width2 5
#property indicator_width3 3
#property indicator_width4 3
#property indicator_width5 4
#property indicator_width6 2
#property indicator_width7 3
//--
input string BBWin="Copyright © 2014 3RJ ~ Roy Philips-Jacobs";
input int AppliedPrice=5;
input int TrendPeriod=66;
//-- indicator_buffers
double bb20ubuf[];
double bb20lbuf[];
double bb2lubuf[];
double bb2llbuf[];
double bb10buf[];
double bbm5buf[];
double mtrnbuf[];
double prcmove;
//--
int mak=5;
int peri=20;
int devb2=2;
//--
string symbol;
string CopyR;
//--
void EventSetTimer();
//---
//+------------------------------------------------------------------+
//| Custom indicator initialization function                         |
//+------------------------------------------------------------------+
int OnInit()
  {
//--- indicator property
   symbol=_Symbol;
   CopyR="Copyright © 2014 3RJ ~ Roy Philips-Jacobs";
//---
//--- indicator buffers mapping
   IndicatorBuffers(7);
   //---
   SetIndexBuffer(0,bb20ubuf);
   SetIndexBuffer(1,bb20lbuf);
   SetIndexBuffer(2,bb2lubuf);
   SetIndexBuffer(3,bb2llbuf);
   SetIndexBuffer(4,bb10buf);
   SetIndexBuffer(5,bbm5buf);
   SetIndexBuffer(6,mtrnbuf);
   //--- indicator line drawing
   SetIndexStyle(0,DRAW_HISTOGRAM,STYLE_SOLID,EMPTY,clrSnow);
   SetIndexStyle(1,DRAW_HISTOGRAM,STYLE_SOLID,EMPTY,clrSnow);
   SetIndexStyle(2,DRAW_LINE,STYLE_SOLID,EMPTY,clrSnow);
   SetIndexStyle(3,DRAW_LINE,STYLE_SOLID,EMPTY,clrSnow);
   SetIndexStyle(4,DRAW_HISTOGRAM,STYLE_SOLID,EMPTY,clrBlack);
   SetIndexStyle(5,DRAW_LINE,STYLE_SOLID,EMPTY,clrRed);
   SetIndexStyle(6,DRAW_LINE,STYLE_SOLID,EMPTY,clrLimeGreen);
   //--- name for DataWindow and indicator subwindow label
   SetIndexLabel(0,NULL);
   SetIndexLabel(1,NULL);
   SetIndexLabel(2,"UpperLine");
   SetIndexLabel(3,"LowerLine");
   SetIndexLabel(4,NULL);
   SetIndexLabel(5,"Direction");
   SetIndexLabel(6,"Trend");
   //--
   IndicatorShortName("BBWin");
   IndicatorDigits(Digits);
   //--
//---
   return(INIT_SUCCEEDED);
  }
//---
//+------------------------------------------------------------------+
//| Custom indicator deinitialization function                       |
//+------------------------------------------------------------------+
void OnDeinit(const int reason)
  {
//----
   EventKillTimer();
   GlobalVariablesDeleteAll();
//----
   return;
  }
//---
//+------------------------------------------------------------------+
//| Custom indicator iteration function                              |
//+------------------------------------------------------------------+
int OnCalculate(const int rates_total,
                const int prev_calculated,
                const datetime &time[],
                const double &open[],
                const double &high[],
                const double &low[],
                const double &close[],
                const long &tick_volume[],
                const long &volume[],
                const int &spread[])
  {
//---
   if(BBWin!=CopyR) return(0);
//---
   int i,limit;
//--- check for bars count
   if(rates_total<=TrendPeriod) return(0);
//--- last counted bar will be recounted
   limit=rates_total-prev_calculated;
   if(prev_calculated>0) limit++;
   //--
//--- counting from rates_total to 0
   ArraySetAsSeries(bb20ubuf,true);
   ArraySetAsSeries(bb20lbuf,true);
   ArraySetAsSeries(bb2lubuf,true);
   ArraySetAsSeries(bb2llbuf,true);
   ArraySetAsSeries(bb10buf,true);
   ArraySetAsSeries(bbm5buf,true);
   ArraySetAsSeries(mtrnbuf,true);
   ArraySetAsSeries(low,true);
   ArraySetAsSeries(high,true);
   ArraySetAsSeries(close,true);
   //--
//--- main cycle
   for(i=limit-1; i>=0; i--)
     {
       //---
       mtrnbuf[i]=iMA(symbol,0,peri,0,MODE_SMA,PRICE_MEDIAN,i)-iMA(symbol,0,TrendPeriod,0,MODE_SMA,PRICE_MEDIAN,i);
       //--
       switch(AppliedPrice)
         {
           case 0:
                   prcmove=iClose(symbol,0,i);
                   break;
           case 1:
                   prcmove=iOpen(symbol,0,i);
                   break;
           case 2:
                   prcmove=iHigh(symbol,0,i);
                   break;
           case 3:
                   prcmove=iLow(symbol,0,i);
                   break;
           case 4:
                   prcmove=(iHigh(symbol,0,i)+iLow(symbol,0,i))/2;
                   break;
           case 5:
                   prcmove=(iHigh(symbol,0,i)+iLow(symbol,0,i)+iClose(symbol,0,i))/3;
                   break;
           case 6:
                   prcmove=(iHigh(symbol,0,i)+iLow(symbol,0,i)+iClose(symbol,0,i)+iClose(symbol,0,i))/4;
                   break;
         }
       //--
       bb20ubuf[i]=(iBands(symbol,0,peri,devb2,0,PRICE_MEDIAN,1,i)-iMA(symbol,0,peri,0,MODE_SMA,PRICE_MEDIAN,i));
       bb20lbuf[i]=(iBands(symbol,0,peri,devb2,0,PRICE_MEDIAN,2,i)-iMA(symbol,0,peri,0,MODE_SMA,PRICE_MEDIAN,i));
       bb2lubuf[i]=(iBands(symbol,0,peri,devb2,0,PRICE_MEDIAN,1,i)-iMA(symbol,0,peri,0,MODE_SMA,PRICE_MEDIAN,i));
       bb2llbuf[i]=(iBands(symbol,0,peri,devb2,0,PRICE_MEDIAN,2,i)-iMA(symbol,0,peri,0,MODE_SMA,PRICE_MEDIAN,i));
       //--
       if(prcmove>=iMA(symbol,0,peri,0,MODE_SMA,PRICE_MEDIAN,i))
         {
           //--
           bb10buf[i]=(iBands(symbol,0,peri,devb2,0,PRICE_MEDIAN,1,i)-iMA(symbol,0,peri,0,MODE_SMA,PRICE_MEDIAN,i))-
                      (iBands(symbol,0,peri,devb2,0,PRICE_MEDIAN,1,i)-iMA(symbol,0,mak,0,MODE_SMA,PRICE_MEDIAN,i));
           bbm5buf[i]=(iBands(symbol,0,peri,devb2,0,PRICE_MEDIAN,1,i)-iMA(symbol,0,peri,0,MODE_SMA,PRICE_MEDIAN,i))-
                      (iBands(symbol,0,peri,devb2,0,PRICE_MEDIAN,1,i)-iMA(symbol,0,mak,0,MODE_SMA,PRICE_MEDIAN,i));
           //--
         }
       else
         {
           //--
           bb10buf[i]=(iBands(symbol,0,peri,devb2,0,PRICE_MEDIAN,2,i)-iMA(symbol,0,peri,0,MODE_SMA,PRICE_MEDIAN,i))+
                      (iMA(symbol,0,mak,0,MODE_SMA,PRICE_MEDIAN,i)-iBands(symbol,0,peri,devb2,0,PRICE_MEDIAN,2,i));
           bbm5buf[i]=(iBands(symbol,0,peri,devb2,0,PRICE_MEDIAN,2,i)-iMA(symbol,0,peri,0,MODE_SMA,PRICE_MEDIAN,i))+
                      (iMA(symbol,0,mak,0,MODE_SMA,PRICE_MEDIAN,i)-iBands(symbol,0,peri,devb2,0,PRICE_MEDIAN,2,i));
           //--
         }
       //---
     }
   //---
//--- return value of prev_calculated for next call
   return(rates_total);
  }
//+------------------------------------------------------------------+
Comments