emas
Download script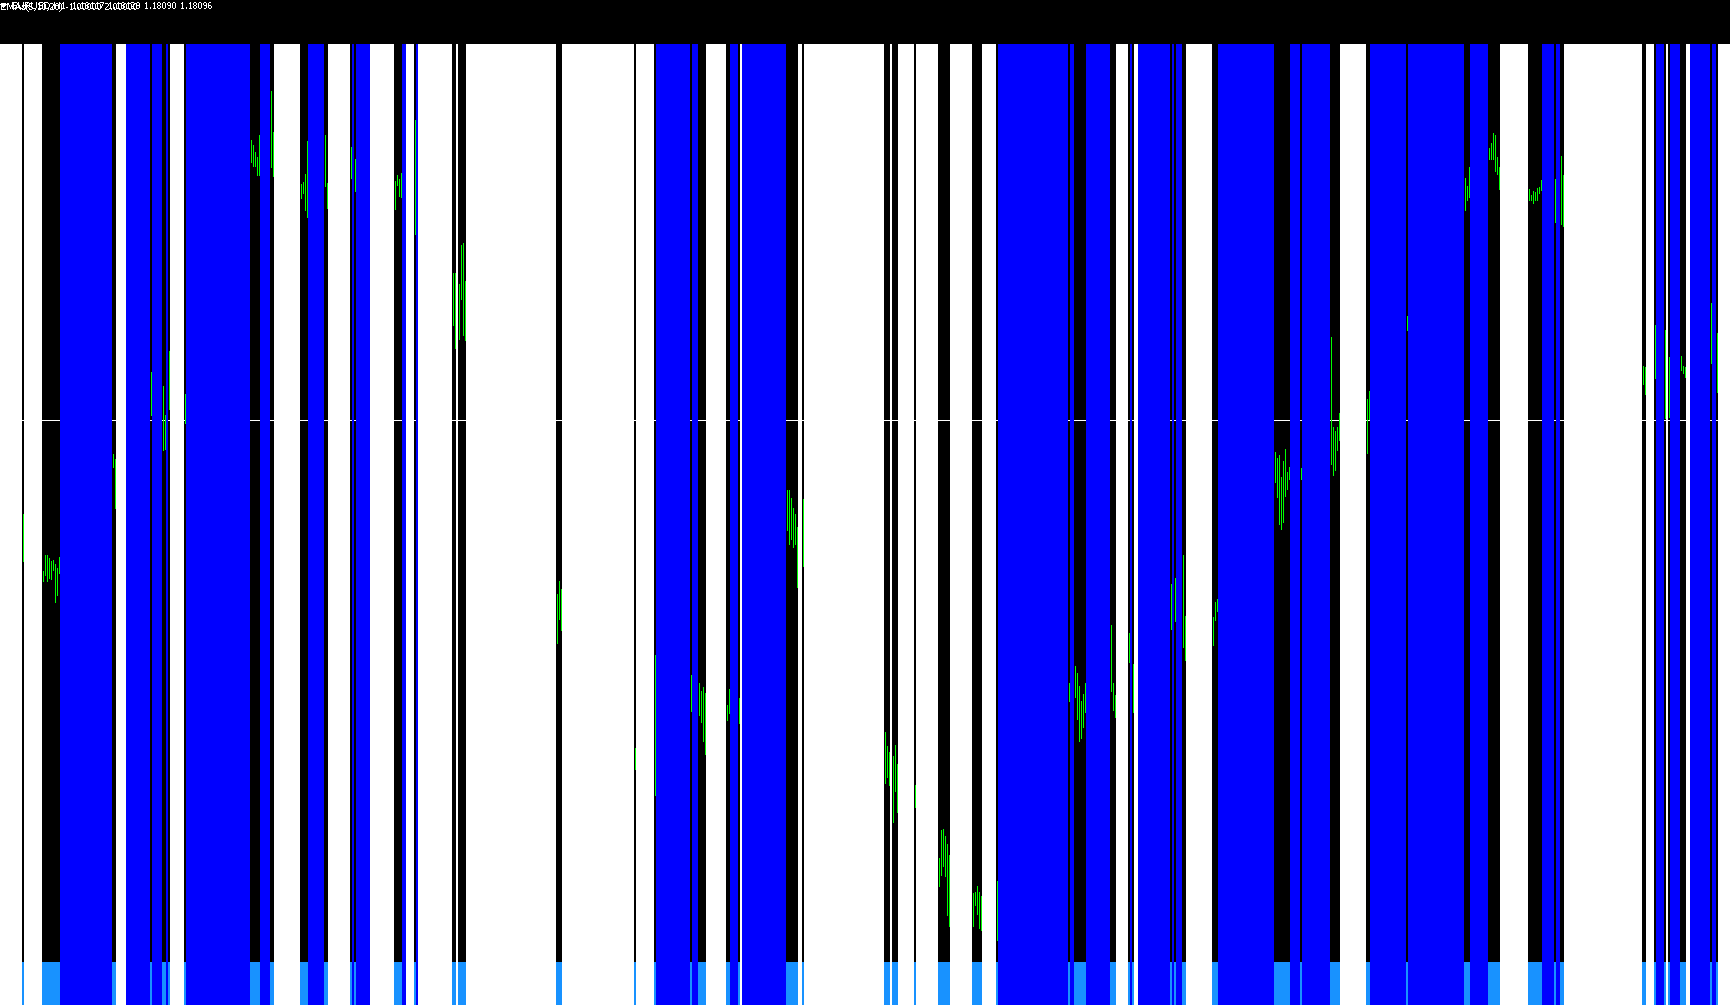
This tool is designed to provide a visual representation of market momentum by analyzing the relationship between three different Exponential Moving Averages (EMAs). Instead of cluttering your main chart with multiple lines, this script simplifies complex price action into a clear, three-state signal displayed in a separate window.
How the Logic Works
The script continuously monitors three distinct timeframes of moving averages (set by the user as 5, 10, and 20 periods by default). It compares these three values to determine the current "trend health" of the market.
1. Trend Identification The core logic evaluates the order of these moving averages to identify specific directional trends:
- Bullish Alignment: If the shortest average is higher than the medium average, and the medium average is higher than the longest average, the script identifies a strong upward trend.
- Bearish Alignment: If the shortest average is lower than the medium average, and the medium average is lower than the longest average, the script identifies a strong downward trend.
2. Visual Signaling Based on these calculations, the script translates the data into three distinct visual signals:
- Green Signal: Triggered when the averages are perfectly aligned in an upward trajectory. This indicates bullish momentum.
- Red Signal: Triggered when the averages are perfectly aligned in a downward trajectory. This indicates bearish momentum.
- Orange Signal: Triggered when the averages are not in a clear sequence (meaning they are "crossing" or flat). This represents a neutral zone or a period of market indecision where no clear trend is established.
Key Benefits for the User
By using this script, you can quickly glance at a dedicated window to see whether the market is currently leaning toward a buy signal, a sell signal, or staying in a neutral state. It filters out the "noise" of individual price ticks and provides a smoothed, easy-to-read summary of the prevailing trend.
//+------------------------------------------------------------------+
//|                                                         EMAs.mq4 |
//|                        Copyright 2014, MetaQuotes Software Corp. |
//|                                              http://www.mql5.com |
//+------------------------------------------------------------------+
#property copyright "Copyright 2014, MetaQuotes Software Corp."
#property link      ""
#property version   "1.00"
#property strict
#property indicator_separate_window
#property indicator_buffers 4
#property indicator_color1 Black
#property indicator_color2 Green
#property indicator_color3 Red
#property indicator_color4 Orange
#property indicator_levelwidth 4
//--- input parameters
input int       MaPeriod1=5;
input int       MaPeriod2=10;
input int       MaPeriod3=20;

//Buffers
double Buffer1[];
double Buffer2[];
double Buffer3[];
double Buffer4[];
//+------------------------------------------------------------------+
//| Custom indicator initialization function                         |
//+------------------------------------------------------------------+
int OnInit()
  {
//--- indicator buffers mapping
   IndicatorDigits(Digits);
   IndicatorShortName("EMAs(" + IntegerToString(MaPeriod1) + "," + IntegerToString(MaPeriod2) + "," + IntegerToString(MaPeriod3) + ")");
   SetIndexStyle(0,DRAW_NONE);
   SetIndexBuffer(0,Buffer1);
   SetIndexStyle(1,DRAW_HISTOGRAM,EMPTY,4);
   SetIndexBuffer(1,Buffer2);
   SetIndexStyle(2,DRAW_HISTOGRAM,EMPTY,4);
   SetIndexBuffer(2,Buffer3);
   SetIndexStyle(3,DRAW_HISTOGRAM,EMPTY,4);
   SetIndexBuffer(3,Buffer4);
//---
   return(INIT_SUCCEEDED);
  }
//+------------------------------------------------------------------+
//| Custom indicator iteration function                              |
//+------------------------------------------------------------------+
int OnCalculate(const int rates_total,
                const int prev_calculated,
                const datetime &time[],
                const double &open[],
                const double &high[],
                const double &low[],
                const double &close[],
                const long &tick_volume[],
                const long &volume[],
                const int &spread[])
  {
//---
   int    countedBars=prev_calculated;
   double ma1, ma2, ma3;
//----
   if(Bars<MaPeriod3)return(0);

   for(int i=Bars-countedBars-1; i>=0; i--){
      Buffer1[i]=0;

      ma1 = iMA(NULL,0,MaPeriod1,0,MODE_EMA,PRICE_CLOSE,i);
      ma2 = iMA(NULL,0,MaPeriod2,0,MODE_EMA,PRICE_CLOSE,i);
      ma3 = iMA(NULL,0,MaPeriod3,0,MODE_EMA,PRICE_CLOSE,i);

      if(ma1>ma2 && ma2>ma3){
         Buffer1[i]+=1;
      }else if(ma1<ma2 && ma2<ma3){
         Buffer1[i]-=1;
      }

      if(Buffer1[i]>0){
         Buffer2[i]=2;
         Buffer3[i]=EMPTY_VALUE;
         Buffer4[i]=EMPTY_VALUE;
      }else if(Buffer1[i]<0){
         Buffer2[i]=EMPTY_VALUE;
         Buffer3[i]=2;
         Buffer4[i]=EMPTY_VALUE;
      }else{
         Buffer2[i]=EMPTY_VALUE;
         Buffer3[i]=EMPTY_VALUE;
         Buffer4[i]=1.5;
      }
   }
//--- return value of prev_calculated for next call
   return(rates_total);
  }
//+------------------------------------------------------------------+
Comments