ADX_Cross_Hull_Style_v1
Download script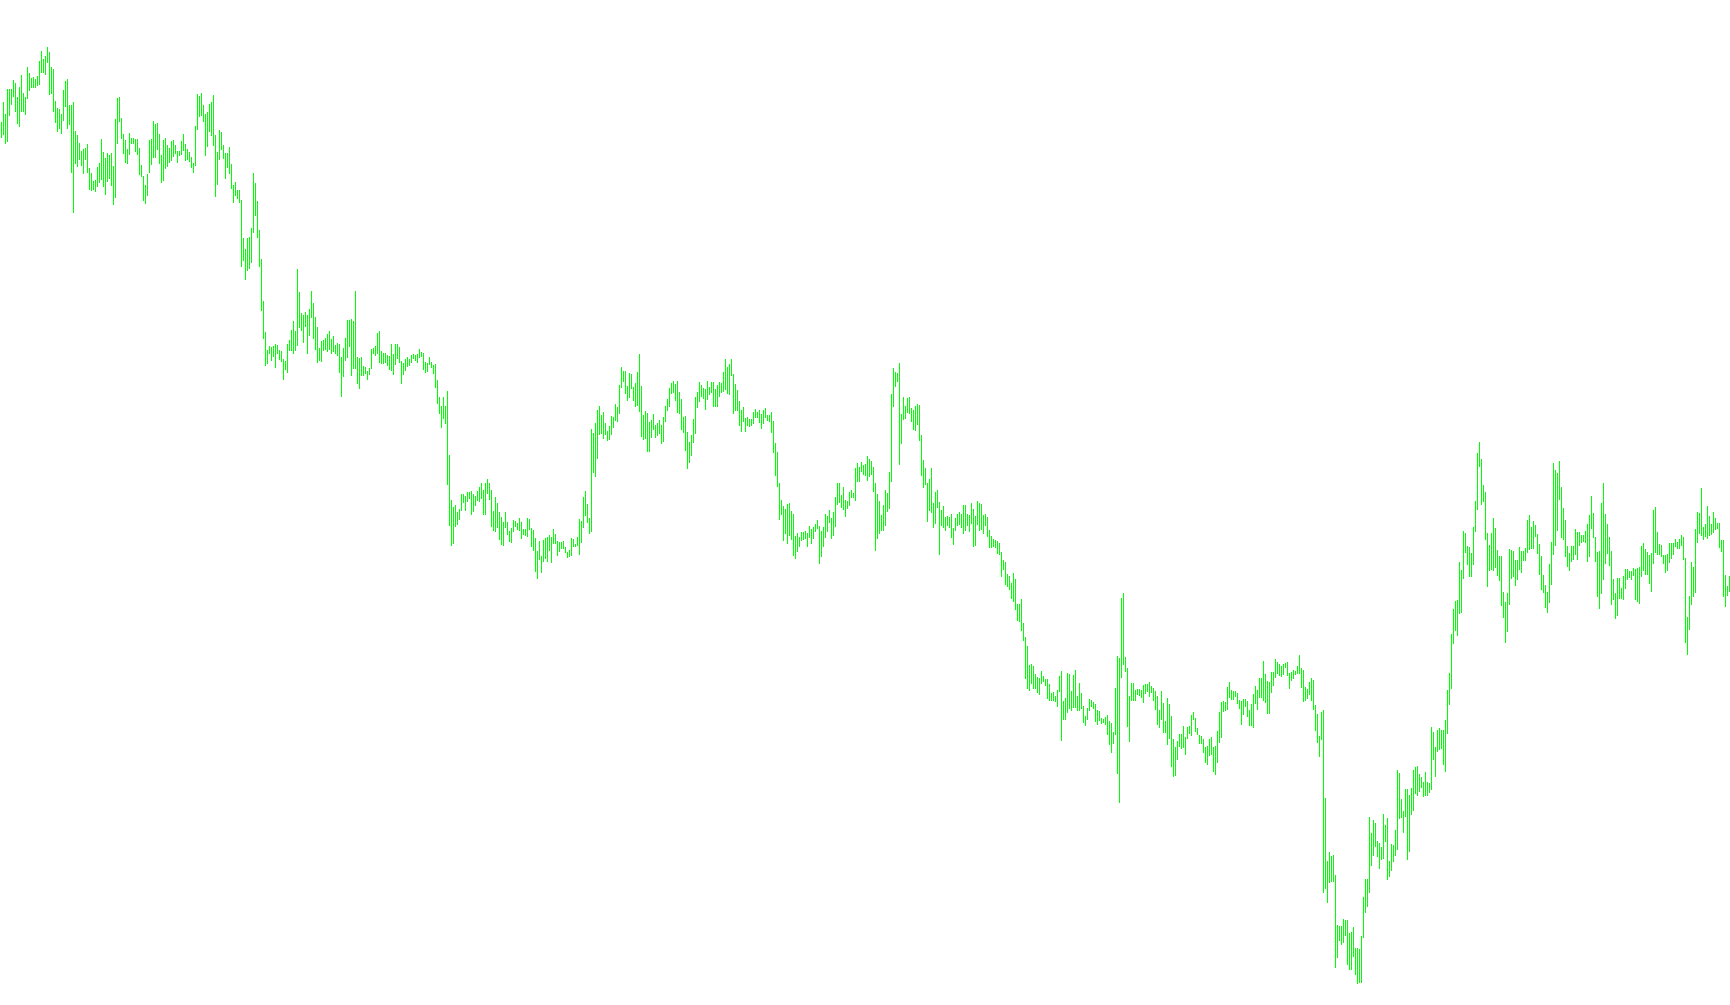
This script is designed as a visual trading tool for the MetaTrader platform that identifies specific momentum shifts in the market. Instead of drawing complex lines, it places clear visual markers (arrows) on your price chart to highlight potential trend reversals based on the ADX (Average Directional Index) indicator.
How the Logic Works
The script monitors two primary components of market movement: upward momentum and downward momentum. It analyzes how these forces interact over a specific timeframe to detect "crosses"—moments where the dominance of one direction shifts to the other.
1. Momentum Analysis The tool calculates the strength of both buying and selling pressure using a standard technical average. It looks at two different speeds of calculation simultaneously:
- A faster, shorter-term momentum reading.
- A slower, longer-term momentum reading.
2. The "Cross" Detection By comparing these two different speeds, the script identifies precise turning points:
- Bullish Signal: When the short-term buying pressure moves from being weaker than the selling pressure to becoming stronger than it (a "cross up"), the script triggers a signal. This suggests that upward momentum is beginning to take over.
- Bearish Signal: Conversely, if the short-term selling pressure moves from being weaker than the buying pressure to becoming stronger (a "cross down"), it indicates that downward momentum is gaining control.
3. Visual Representation Once a cross is detected, the script places markers directly on your chart:
- Upward Markers: Placed below the low of a price candle to signal a potential move toward the upside.
- Downward Markers: Placed above the high of a price candle to signal a potential move toward the downside.
4. Smart Positioning To ensure the visual markers do not clutter the actual price candles, the script features an automated "offset" system. Depending on which timeframe you are viewing (e.g., 1-minute, 1-hour, or Daily charts), it automatically calculates a small distance to place the arrows at a professional gap away from the bars, keeping your chart clean and easy to read.
Summary for the Trader
Essentially, this tool filters through the noise of price movements to find the exact moment when buying pressure overtakes selling pressure (or vice versa). It converts complex mathematical momentum data into simple visual cues, helping you identify potential trend changes at a glance.
/*-----------------------------+
|			       |
| Shared by www.Aptrafx.com    |
|			       |
+------------------------------*/

//+------------------------------------------------------------------+
//|                                         ADX_Cross_Hull_Style.mq4 |
//+------------------------------------------------------------------+

#property indicator_chart_window
#property indicator_buffers 2
#property indicator_color1 White
#property indicator_color2 HotPink

extern int PlusDiMinusDi_Period = 14;
extern int Applied_Price        =  0; // 0 Close , 1 Open , 2 High , 3 Low , 4 Median , 5 Typical , 6 Weighted
extern int LineWidth            =  0;
extern int ShowBars             =  1000;

double ExtMapBuffer1[];
double ExtMapBuffer2[];

double b4plusdi, b4minusdi, nowplusdi, nowminusdi;

int    nShift;

//+------------------------------------------------------------------+
//| Custom indicator initialization function                         |
//+------------------------------------------------------------------+

int init()
  {
    SetIndexEmptyValue(0,0.00000000);
    SetIndexStyle(0, DRAW_ARROW, STYLE_SOLID, LineWidth);
    SetIndexArrow(0, 225);
    SetIndexBuffer(0, ExtMapBuffer1);
    SetIndexLabel(0, "ADX Up mode 0");

    SetIndexEmptyValue(1,0.00000000);
    SetIndexStyle(1, DRAW_ARROW, STYLE_SOLID, LineWidth);
    SetIndexArrow(1, 226);
    SetIndexBuffer(1, ExtMapBuffer2);
    SetIndexLabel(1, "ADX Dn mode 1");

    IndicatorShortName("ADX_Cross_Hull_Style(" + PlusDiMinusDi_Period + ")");

    switch(Period())
      {
        case     1: nShift = 1;   break;
        case     5: nShift = 3;   break;
        case    15: nShift = 5;   break;
        case    30: nShift = 10;  break;
        case    60: nShift = 15;  break;
        case   240: nShift = 20;  break;
        case  1440: nShift = 80;  break;
        case 10080: nShift = 100; break;
        case 43200: nShift = 200; break;
      }

    return(0);
  }

//+------------------------------------------------------------------+
//| Custor indicator deinitialization function                       |
//+------------------------------------------------------------------+

int deinit()
  {

    return(0);
  }

//+------------------------------------------------------------------+
//| Custom indicator iteration function                              |
//+------------------------------------------------------------------+

int start()
  {
    int limit,i;
    int counted_bars = IndicatorCounted();

    if(counted_bars < 0)
        return(-1);

    if(counted_bars > 0)
        counted_bars--;

    limit = ShowBars;

    if (limit >= Bars) limit = Bars - PlusDiMinusDi_Period;

    for(i=0; i<limit; i++)
     {
       b4plusdi = (iADX(Symbol(),0,MathFloor(PlusDiMinusDi_Period/2),Applied_Price,MODE_PLUSDI,i+1)*2)
                - iADX(Symbol(),0,PlusDiMinusDi_Period,Applied_Price,MODE_PLUSDI,i+1);
       nowplusdi = (iADX(Symbol(),0,MathFloor(PlusDiMinusDi_Period/2),Applied_Price,MODE_PLUSDI,i)*2)
                 - iADX(Symbol(),0,PlusDiMinusDi_Period,Applied_Price,MODE_PLUSDI,i);

       b4minusdi = (iADX(Symbol(),0,MathFloor(PlusDiMinusDi_Period/2),Applied_Price,MODE_MINUSDI,i+1)*2)
                 - iADX(Symbol(),0,PlusDiMinusDi_Period,Applied_Price,MODE_MINUSDI,i+1);
       nowminusdi = (iADX(Symbol(),0,MathFloor(PlusDiMinusDi_Period/2),Applied_Price,MODE_MINUSDI,i)*2)
                  - iADX(Symbol(),0,PlusDiMinusDi_Period,Applied_Price,MODE_MINUSDI,i);

       if (b4plusdi < b4minusdi && nowplusdi > nowminusdi) { ExtMapBuffer1[i] = Low[i]  - nShift*Point; } else { ExtMapBuffer1[i] = 0.00000000; }

       if (b4plusdi > b4minusdi && nowplusdi < nowminusdi) { ExtMapBuffer2[i] = High[i] + nShift*Point; } else { ExtMapBuffer2[i] = 0.00000000; }
     }
    return(0);
  }
Comments