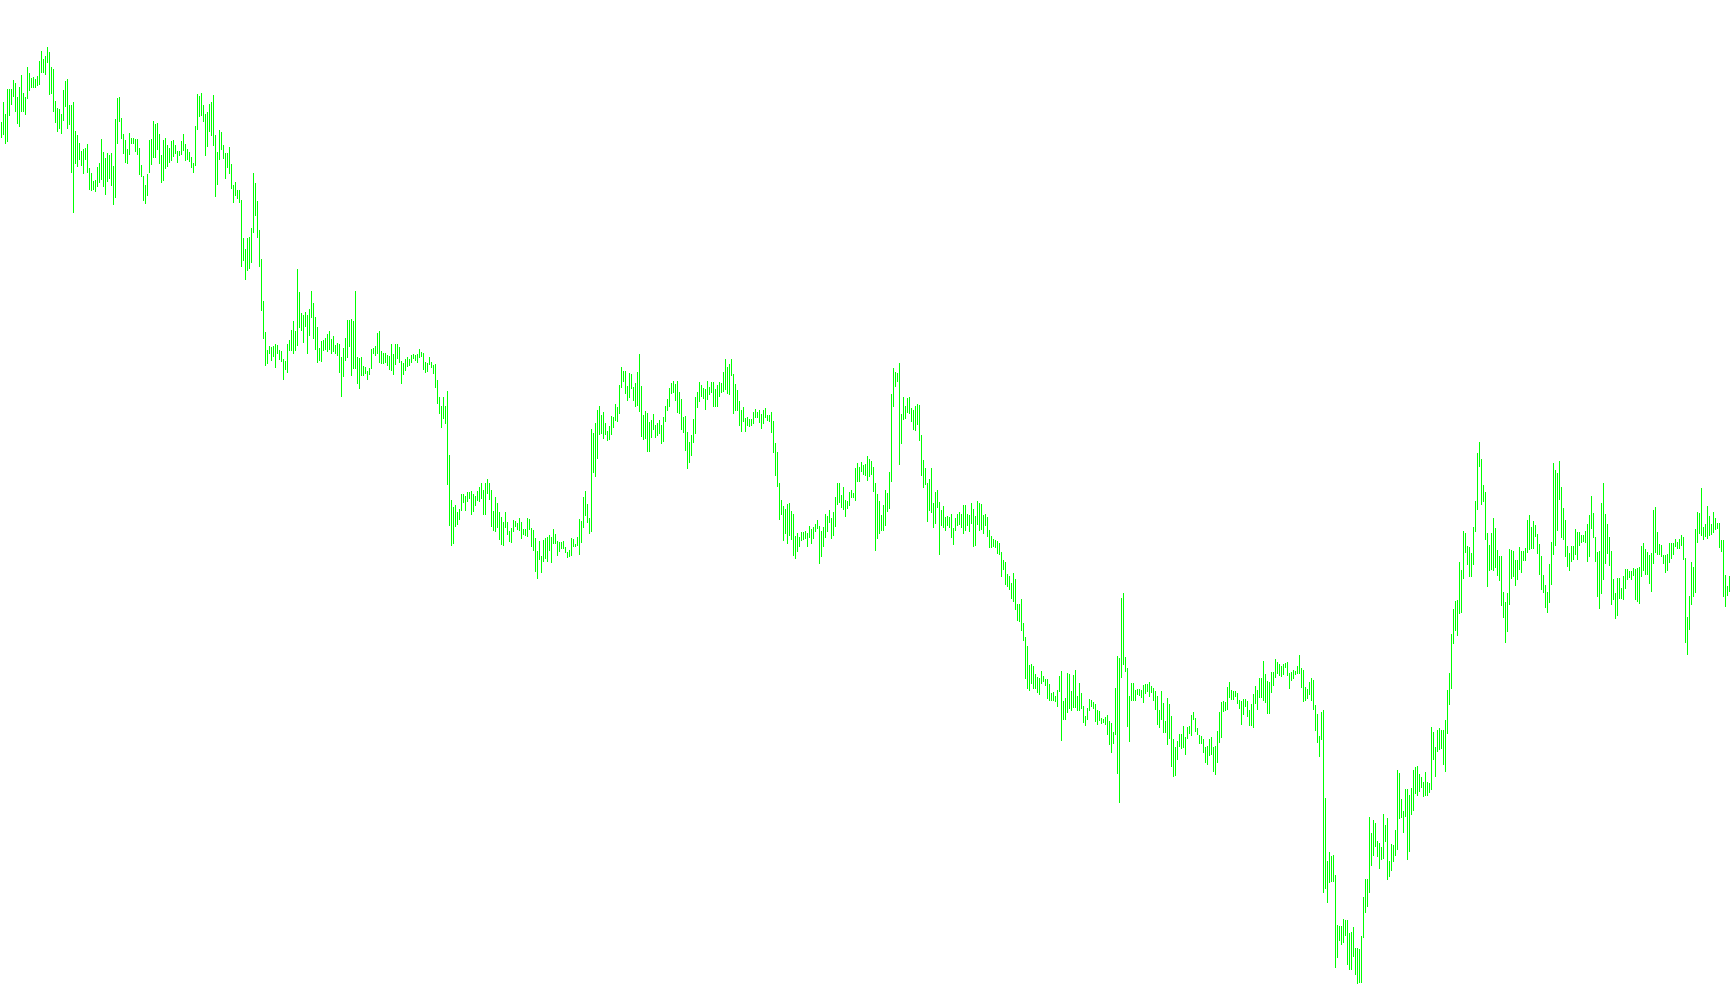
This script is designed as a visual trading tool for the MetaTrader platform that identifies specific moments in market momentum shifts. Rather than displaying a continuous line, it places distinct visual markers (arrows) on your chart to highlight potential transition points between upward and downward price pressure.
Core Logic Overview
The tool operates by analyzing two primary components of market direction: the Plus Directional Index (+DI), which represents upward pressure, and the Minus Directional Index (-DI), which represents downward pressure.
Instead of looking at these indicators in a standard way, the script uses a unique "Cross Hull" mathematical approach. It compares the current momentum values against a smoothed average of the past. By calculating the difference between a shorter-term movement and a longer-term average, the tool filters out "noise" and focuses on significant structural changes in the market.
How it Identifies Signals
The script looks for specific "crossover" events to trigger its visual markers:
- Bullish Signals (Upward Momentum): The script identifies a point where the upward pressure index was previously lower than the downward pressure, but has now surged above it. When this crossover occurs, a marker is placed below the price candle.
- Bearish Signals (Downward Momentum): Conversely, if the downward pressure index was previously lower but has now crossed above the upward pressure, the script identifies a shift toward selling pressure and places a marker above the price candle.
Dynamic Adjustments
To ensure the tool remains readable across different types of trading, it includes several smart features:
- Timeframe Awareness: The script automatically detects which timeframe you are viewing (e.g., 1-minute, 1-hour, or Daily). It then applies a specific "offset" or buffer to the markers. This ensures that on very fast charts, the arrows don't clutter the candles, while on slow charts, they remain clearly visible.
- Customizable Sensitivity: Users can adjust the calculation period. A shorter period makes the tool more sensitive to quick price fluctuations, while a longer period focuses on broader, more significant trends.
- Price Source Flexibility: The logic can be told to look at different parts of the candle—such as the closing price, the high/low points, or the average price—allowing you to tailor the sensitivity to your specific trading style.
Summary for the User
In simple terms, this tool acts as a "momentum alert system." It watches the hidden tug-of-war between buyers and sellers and places an arrow on your chart the moment one side takes control from the other. This allows you to see clearly where trends might be shifting without having to manually interpret complex overlapping lines.
//+------------------------------------------------------------------+
//|                                         ADX_Cross_Hull_Style.mq4 |
//+------------------------------------------------------------------+

#property indicator_chart_window
#property indicator_buffers 2
#property indicator_color1 White
#property indicator_color2 HotPink

extern int PlusDiMinusDi_Period = 14;
extern int Applied_Price        =  0; // 0 Close , 1 Open , 2 High , 3 Low , 4 Median , 5 Typical , 6 Weighted
extern int LineWidth            =  0;
extern int ShowBars             =  1000;

double ExtMapBuffer1[];
double ExtMapBuffer2[];

double b4plusdi, b4minusdi, nowplusdi, nowminusdi;

int    nShift;

//+------------------------------------------------------------------+
//| Custom indicator initialization function                         |
//+------------------------------------------------------------------+

int init()
  {
    SetIndexEmptyValue(0,0.00000000);
    SetIndexStyle(0, DRAW_ARROW, STYLE_SOLID, LineWidth);
    SetIndexArrow(0, 225);
    SetIndexBuffer(0, ExtMapBuffer1);
    SetIndexLabel(0, "ADX Up mode 0");

    SetIndexEmptyValue(1,0.00000000);
    SetIndexStyle(1, DRAW_ARROW, STYLE_SOLID, LineWidth);
    SetIndexArrow(1, 226);
    SetIndexBuffer(1, ExtMapBuffer2);
    SetIndexLabel(1, "ADX Dn mode 1");

    IndicatorShortName("ADX_Cross_Hull_Style(" + PlusDiMinusDi_Period + ")");

    switch(Period())
      {
        case     1: nShift = 1;   break;
        case     5: nShift = 3;   break;
        case    15: nShift = 5;   break;
        case    30: nShift = 10;  break;
        case    60: nShift = 15;  break;
        case   240: nShift = 20;  break;
        case  1440: nShift = 80;  break;
        case 10080: nShift = 100; break;
        case 43200: nShift = 200; break;
      }

    return(0);
  }

//+------------------------------------------------------------------+
//| Custor indicator deinitialization function                       |
//+------------------------------------------------------------------+

int deinit()
  {

    return(0);
  }

//+------------------------------------------------------------------+
//| Custom indicator iteration function                              |
//+------------------------------------------------------------------+

int start()
  {
    int limit,i;
    int counted_bars = IndicatorCounted();

    if(counted_bars < 0)
        return(-1);

    if(counted_bars > 0)
        counted_bars--;

    limit = ShowBars;

    if (limit >= Bars) limit = Bars - PlusDiMinusDi_Period;

    for(i=0; i<limit; i++)
     {
       b4plusdi = (iADX(Symbol(),0,MathFloor(PlusDiMinusDi_Period/2),Applied_Price,MODE_PLUSDI,i+1)*2)
                - iADX(Symbol(),0,PlusDiMinusDi_Period,Applied_Price,MODE_PLUSDI,i+1);
       nowplusdi = (iADX(Symbol(),0,MathFloor(PlusDiMinusDi_Period/2),Applied_Price,MODE_PLUSDI,i)*2)
                 - iADX(Symbol(),0,PlusDiMinusDi_Period,Applied_Price,MODE_PLUSDI,i);

       b4minusdi = (iADX(Symbol(),0,MathFloor(PlusDiMinusDi_Period/2),Applied_Price,MODE_MINUSDI,i+1)*2)
                 - iADX(Symbol(),0,PlusDiMinusDi_Period,Applied_Price,MODE_MINUSDI,i+1);
       nowminusdi = (iADX(Symbol(),0,MathFloor(PlusDiMinusDi_Period/2),Applied_Price,MODE_MINUSDI,i)*2)
                  - iADX(Symbol(),0,PlusDiMinusDi_Period,Applied_Price,MODE_MINUSDI,i);

       if (b4plusdi < b4minusdi && nowplusdi > nowminusdi) { ExtMapBuffer1[i] = Low[i]  - nShift*Point; } else { ExtMapBuffer1[i] = 0.00000000; }

       if (b4plusdi > b4minusdi && nowplusdi < nowminusdi) { ExtMapBuffer2[i] = High[i] + nShift*Point; } else { ExtMapBuffer2[i] = 0.00000000; }
     }
    return(0);
  }
Comments