adx
Download script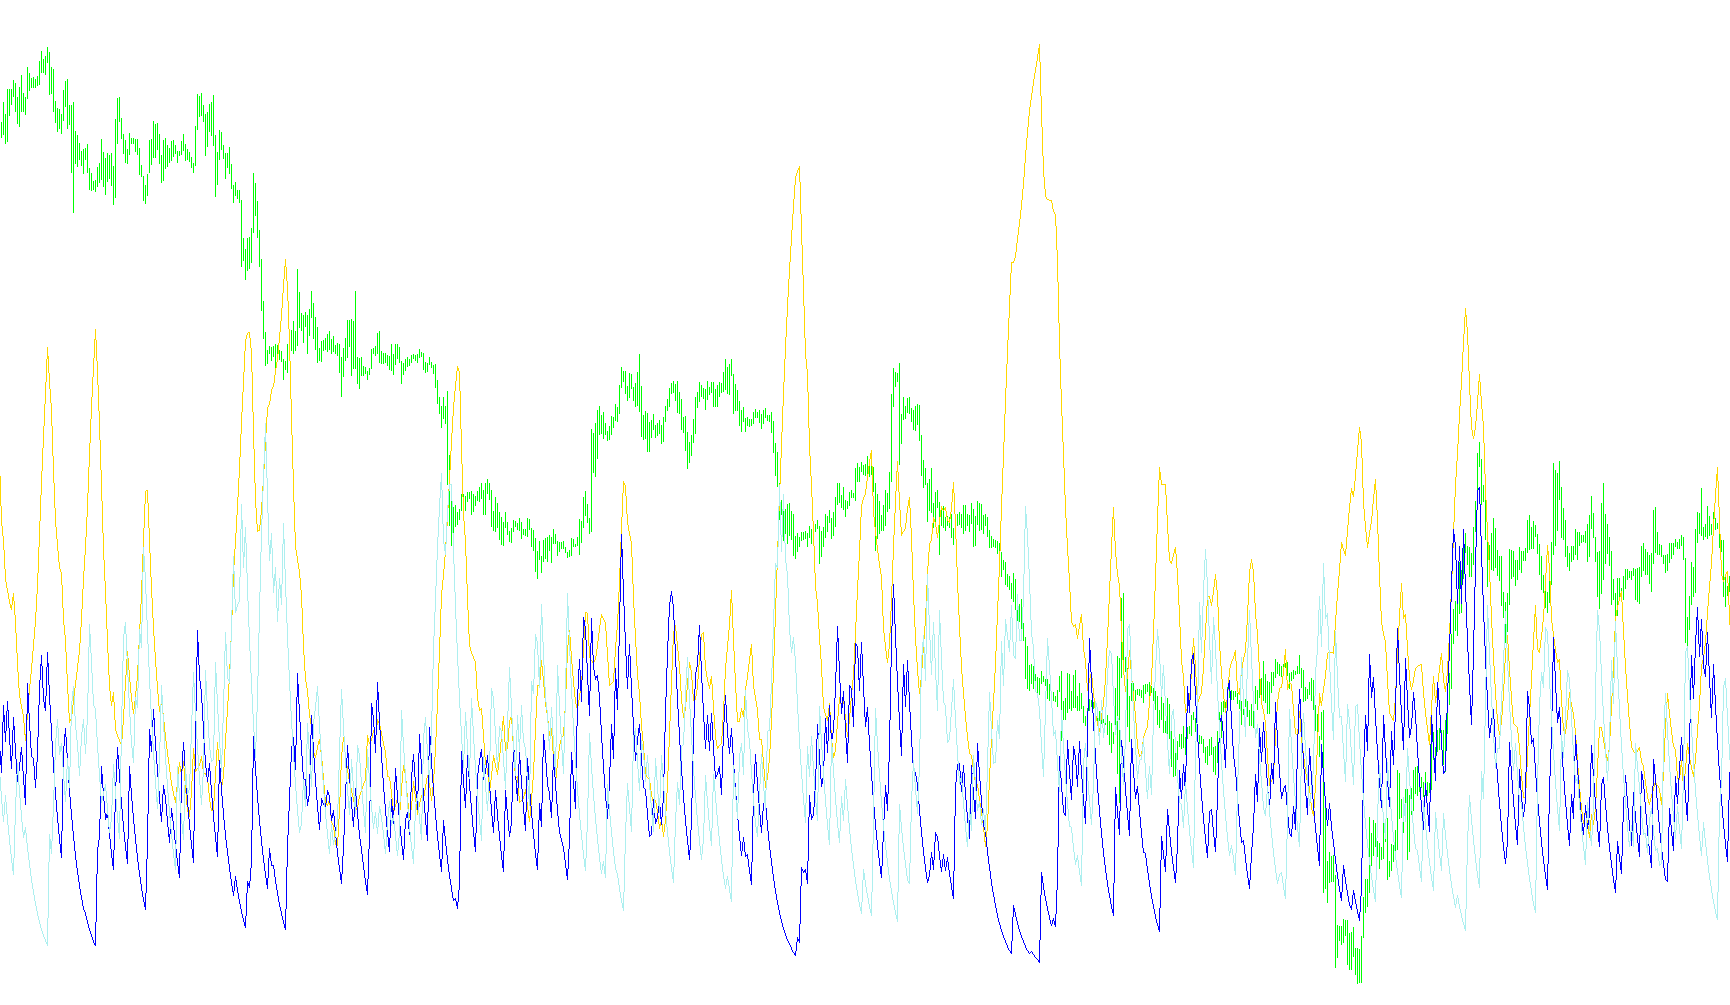
This script is designed to provide a clear visual representation of market trends by analyzing price movements in two primary directions: upward and downward. Instead of just showing you the price, it calculates the strength and direction of the current market momentum, helping traders distinguish between trending markets and sideways "choppy" price action.
How the Logic Works
The tool operates through a multi-step mathematical process to filter out market noise:
1. Identifying Movement (Directional Movement) The script first looks at each price candle to determine if the market moved more significantly to the upside or the downside. It compares the current high and low prices against the previous candle's data. If the upward movement is greater, it records a positive direction; if the downward movement is greater, it records a negative direction.
2. Normalizing the Data (True Range) To ensure the results are consistent regardless of how volatile the market is, the script uses a "True Range" calculation. This standardizes the movements into a percentage-based scale. This step ensures that a small move in a calm market is weighted similarly to a large move in a highly volatile one.
3. Smoothing the Signal (+DI and -DI) Raw market data is often erratic and "jumpy." To create a usable visual, the script applies an Exponential Moving Average (EMA) to the positive and negative directions identified in the previous steps. This results in two smooth lines:
- +DI: Represents the strength of the upward trend.
- -DI: Represents the strength of the downward trend.
4. Measuring Trend Intensity (DX and ADX) Finally, the script calculates the "DX," which is the difference between the positive and negative trend lines. It then applies one last smoothing pass (another EMA) to this result to produce the ADX (Average Directional Index).
What This Means for the User
The final output provides three distinct pieces of information:
- Trend Direction: By observing which line (+DI or -DI) is on top, you can see which direction currently has more momentum.
- Trend Strength: The ADX value specifically measures how "strong" the overall trend is, regardless of direction. A rising ADX indicates a strengthening trend (either up or down), while a falling ADX suggests the market is losing its momentum and may be entering a period of consolidation.
- Visual Clarity: By using smoothed averages, the script helps you avoid making hasty decisions based on minor price flickers, providing a more stable "big picture" view of the market's health.
//+------------------------------------------------------------------+
//|                                                          ADX.mq4 |
//|                      Copyright © 2004, MetaQuotes Software Corp. |
//|                                       http://www.metaquotes.net/ |
//+------------------------------------------------------------------+
#property copyright "Copyright © 2004, MetaQuotes Software Corp."
#property link      "http://www.metaquotes.net/"

#property indicator_separate_window
#property indicator_buffers 3
#property indicator_color1 LightSeaGreen
#property indicator_color2 YellowGreen
#property indicator_color3 Wheat
//---- input parameters
extern int ADXPeriod=14;
//---- buffers
double ADXBuffer[];
double PlusDiBuffer[];
double MinusDiBuffer[];
double PlusSdiBuffer[];
double MinusSdiBuffer[];
double TempBuffer[];
//+------------------------------------------------------------------+
//| Custom indicator initialization function                         |
//+------------------------------------------------------------------+
int init()
  {
//---- 3 additional buffers are used for counting.
   IndicatorBuffers(6);
//---- indicator buffers
   SetIndexBuffer(0,ADXBuffer);
   SetIndexBuffer(1,PlusDiBuffer);
   SetIndexBuffer(2,MinusDiBuffer);
   SetIndexBuffer(3,PlusSdiBuffer);
   SetIndexBuffer(4,MinusSdiBuffer);
   SetIndexBuffer(5,TempBuffer);
//---- name for DataWindow and indicator subwindow label
   IndicatorShortName("ADX("+ADXPeriod+")");
   SetIndexLabel(0,"ADX");
   SetIndexLabel(1,"+DI");
   SetIndexLabel(2,"-DI");
//----
   SetIndexDrawBegin(0,ADXPeriod);
   SetIndexDrawBegin(1,ADXPeriod);
   SetIndexDrawBegin(2,ADXPeriod);
//----
   return(0);
  }
//+------------------------------------------------------------------+
//| Average Directional Movement Index                               |
//+------------------------------------------------------------------+
int start()
  {
   double pdm,mdm,tr;
   double price_high,price_low;
   int    starti,i,counted_bars=IndicatorCounted();
//----
   i=Bars-2;
   PlusSdiBuffer[i+1]=0;
   MinusSdiBuffer[i+1]=0;
   if(counted_bars>=i) i=Bars-counted_bars-1;
   starti=i;
//----
   while(i>=0)
     {
      price_low=Low[i];
      price_high=High[i];
      //----
      pdm=price_high-High[i+1];
      mdm=Low[i+1]-price_low;
      if(pdm<0) pdm=0;  // +DM
      if(mdm<0) mdm=0;  // -DM
      if(pdm==mdm) { pdm=0; mdm=0; }
      else if(pdm<mdm) pdm=0;
           else if(mdm<pdm) mdm=0;
      //---- âû÷èñëÿåì èñòèííûé èíòåðâàë
      double num1=MathAbs(price_high-price_low);
      double num2=MathAbs(price_high-Close[i+1]);
      double num3=MathAbs(price_low-Close[i+1]);
      tr=MathMax(num1,num2);
      tr=MathMax(tr,num3);
      //---- counting plus/minus direction
      if(tr==0) { PlusSdiBuffer[i]=0; MinusSdiBuffer[i]=0; }
      else      { PlusSdiBuffer[i]=100.0*pdm/tr; MinusSdiBuffer[i]=100.0*mdm/tr; }
      //----
      i--;
     }
//---- last counted bar will be recounted
   if(counted_bars>0) counted_bars--;
   int limit=Bars-counted_bars;
//---- apply EMA to +DI
   for(i=0; i<=limit; i++)
      PlusDiBuffer[i]=iMAOnArray(PlusSdiBuffer,Bars,ADXPeriod,0,MODE_EMA,i);
//---- apply EMA to -DI
   for(i=0; i<=limit; i++)
      MinusDiBuffer[i]=iMAOnArray(MinusSdiBuffer,Bars,ADXPeriod,0,MODE_EMA,i);
//---- Directional Movement (DX)
   i=Bars-2;
   TempBuffer[i+1]=0;
   i=starti;
   while(i>=0)
     {
      double div=MathAbs(PlusDiBuffer[i]+MinusDiBuffer[i]);
      if(div==0.00) TempBuffer[i]=0;
      else TempBuffer[i]=100*(MathAbs(PlusDiBuffer[i]-MinusDiBuffer[i])/div);
      i--;
     }
//---- ADX is exponential moving average on DX
   for(i=0; i<limit; i++)
      ADXBuffer[i]=iMAOnArray(TempBuffer,Bars,ADXPeriod,0,MODE_EMA,i);
//----
   return(0);
  }
//+------------------------------------------------------------------+
Comments