adxdon_v1
Download script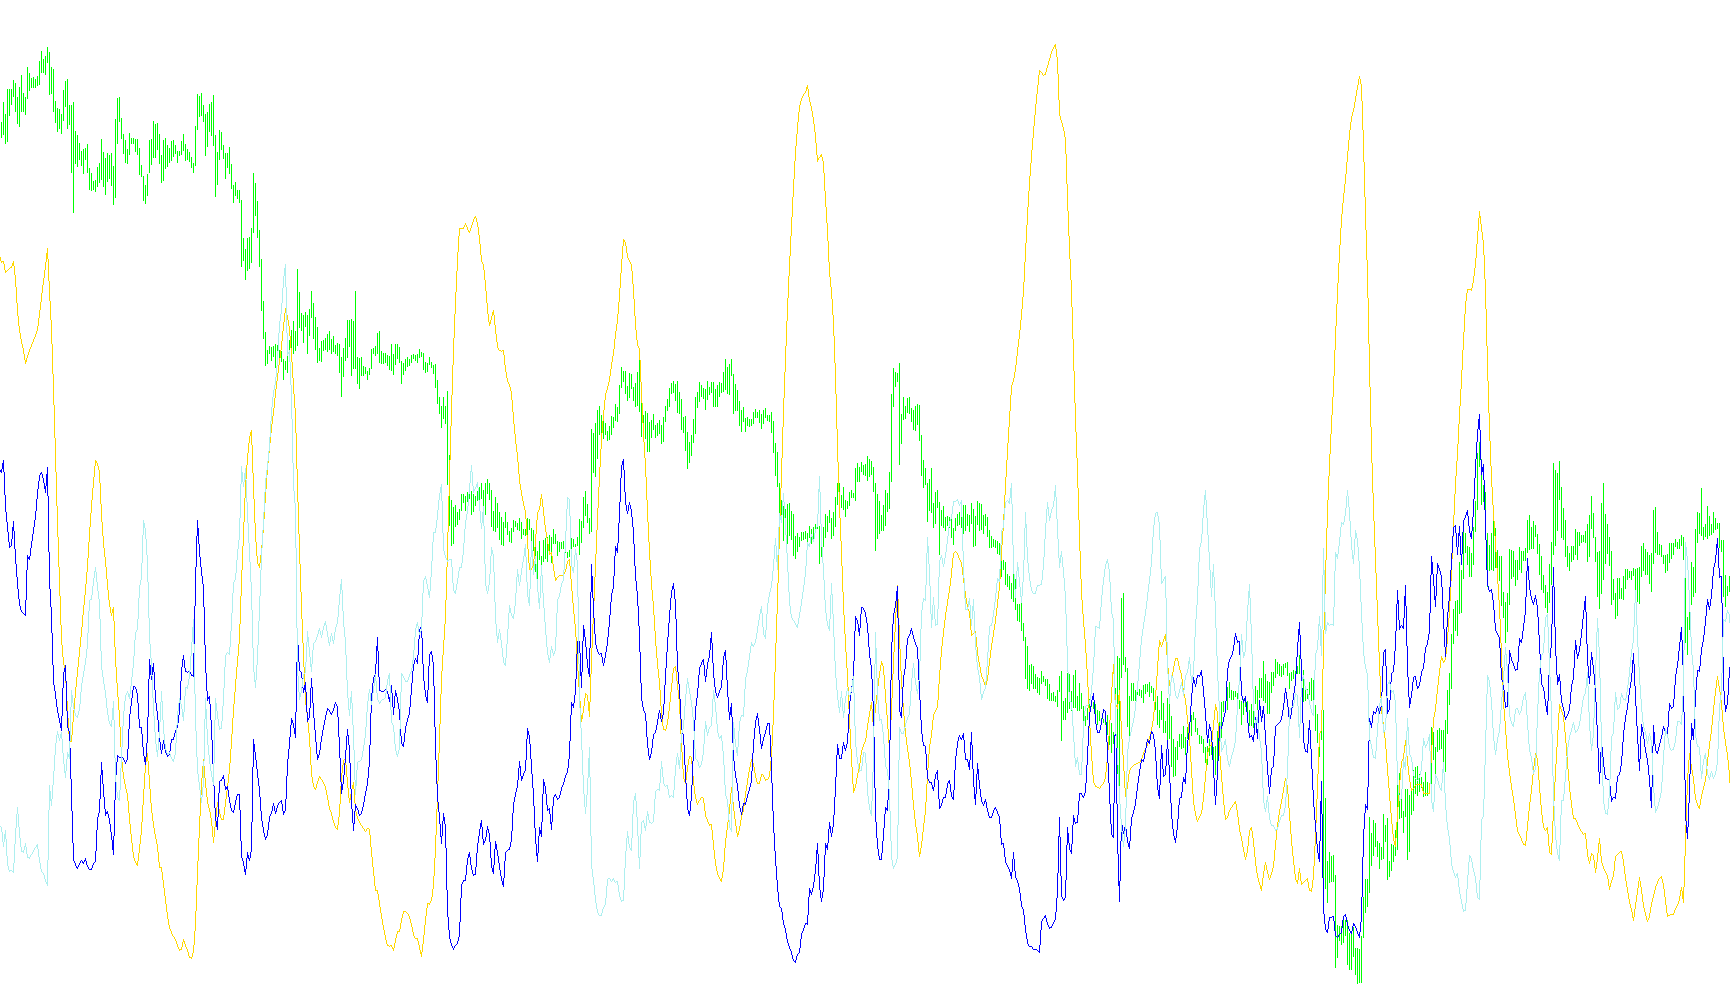
This technical tool is designed to analyze market trends by measuring the strength, direction, and volatility of price movements. Instead of simply looking at where the price is going, it evaluates how aggressively the market is moving in a specific direction relative to its recent history.
The logic operates through three primary stages:
1. Movement Detection
The script begins by examining the high and low prices of current candles compared to previous ones. It identifies "Positive Movement" (upward price growth) and "Negative Movement" (downward price decline). A key feature of this logic is that it filters out neutral movements; if the upward move is smaller than the downward move (or vice versa), the script ignores that data point to ensure only significant directional shifts are captured.
2. Range and Smoothing
To make the data readable and less "jittery," the script calculates a True Range—the maximum distance traveled by the price across different types of movements. It then applies an Exponential Moving Average (EMA) to both the positive and negative movement figures. This smoothing process helps clarify the underlying trend by removing minor market noise, allowing the user to see the core momentum more clearly.
3. Final Indicator Calculation
The script synthesizes all this information into three distinct values:
- +DI and -DI: These represent the specific strength of the bulls (buyers) versus the bears (sellers). They show which side is currently winning the "tug-of-war."
- DX (Directional Index): This calculates the difference between the positive and negative movements. It essentially measures how much one side is dominating the other.
- ADX (Average Directional Index): This is the final output. It takes the DX value and smooths it further using an exponential moving average.
The Bottom Line: While the +DI and -DI lines tell you which way the market is trying to go, the ADX line tells you how strong that trend actually is. A high ADX value indicates a powerful, trending market, while a low ADX suggests a weak, sideways, or choppy market where prices are moving without clear conviction.
/*-----------------------------+
|			       |
| Shared by www.Aptrafx.com    |
|			       |
+------------------------------*/

//+------------------------------------------------------------------+
//|                                                       ADXdon.mq4 |
//|                      Copyright © 2005, MetaQuotes Software Corp. |
//|                                        http://www.metaquotes.net |
//+------------------------------------------------------------------+
#property copyright "Copyright © 2004, MetaQuotes Software Corp."
#property link      "http://www.metaquotes.net/"

#property indicator_separate_window
#property indicator_buffers 3
#property indicator_color1 LightSeaGreen
#property indicator_color2 YellowGreen
#property indicator_color3 Wheat
#property indicator_level1 20
//---- input parameters
extern int ADXPeriod=14, DiPlusPeriod = 34, DiMinusPeriod=34;
//---- buffers
double ADXBuffer[];
double PlusDiBuffer[];
double MinusDiBuffer[];
double PlusSdiBuffer[];
double MinusSdiBuffer[];
double TRBuffer[];
double TempBuffer[];
//+------------------------------------------------------------------+
//| Custom indicator initialization function                         |
//+------------------------------------------------------------------+
int init()
  {
//---- 3 additional buffers are used for counting.
   IndicatorBuffers(7);
//---- indicator buffers
   SetIndexBuffer(0,ADXBuffer);
   SetIndexBuffer(1,PlusDiBuffer);
   SetIndexBuffer(2,MinusDiBuffer);
   SetIndexBuffer(3,PlusSdiBuffer);
   SetIndexBuffer(4,MinusSdiBuffer);
   SetIndexBuffer(5,TempBuffer);
   SetIndexBuffer(6, TRBuffer );
//---- name for DataWindow and indicator subwindow label
   IndicatorShortName("ADX("+ADXPeriod+", DI-: "+DiMinusPeriod+", DI+: "+DiPlusPeriod+")");
   SetIndexLabel(0,"ADX");
   SetIndexLabel(1,"+DI");
   SetIndexLabel(2,"-DI");
//----
   SetIndexDrawBegin(0,ADXPeriod);
   SetIndexDrawBegin(1,ADXPeriod);
   SetIndexDrawBegin(2,ADXPeriod);
//----
   return(0);
  }
//+------------------------------------------------------------------+
//| Average Directional Movement Index                               |
//+------------------------------------------------------------------+
int start()
  {
   double pdm,mdm,tr;
   double price_high,price_low;
   int    starti,i,counted_bars=IndicatorCounted();
//----

    //int limit=Bars-2;
   int limit=Bars-counted_bars;
   if(counted_bars>0) limit++;
   i = limit;
   starti = i;
//----
   while(i>=0)
     {
      price_low=Low[i];
      price_high=High[i];
      //----
      pdm = 0.0;
      mdm = 0.0;
      if ( price_high > High[i+1] )
         pdm = price_high - High[i+1];
      if ( price_low < Low[i+1] )
         mdm = Low[i+1] - price_low;

      if ( pdm < mdm )
         pdm = 0.0;
      else if ( mdm < pdm )
         mdm = 0.0;
      //---- absolute true range
      double num1=MathAbs(price_high-price_low);
      double num2=MathAbs(price_high-Close[i+1]);
      double num3=MathAbs(price_low-Close[i+1]);
      tr=MathMax(num1,num2);
      tr=MathMax(tr,num3);

      //---- counting plus/minus direction
      PlusSdiBuffer[i]=pdm;
      MinusSdiBuffer[i]=mdm;
      TRBuffer[i] = tr;
     //----
      i--;
     }
//---- apply EMA to +DI
   for(i=0; i<limit; i++) {
//----    apply EMA to TR
      TRBuffer[i]=iMAOnArray(TRBuffer,0,ADXPeriod,0,MODE_EMA,i);
      PlusDiBuffer[i] = PlusDiBuffer[i+1];
      MinusDiBuffer[i] = MinusDiBuffer[i+1];
      if ( TRBuffer[i] != 0 ) {
         PlusDiBuffer[i]=iMAOnArray(PlusSdiBuffer,Bars,DiPlusPeriod,0,MODE_EMA,i) / TRBuffer[i];
//----    apply EMA to -DI
         MinusDiBuffer[i]=iMAOnArray(MinusSdiBuffer,Bars,DiMinusPeriod,0,MODE_EMA,i) / TRBuffer[i];
      }
   }
//---- Directional Movement (DX)
   i=Bars-2;
   //TempBuffer[i+1]=0;
   i=starti;
   while(i>=0)
     {
      double div=MathAbs(PlusDiBuffer[i]+MinusDiBuffer[i]);
      if(div==0.00) TempBuffer[i]=TempBuffer[i+1];
      else TempBuffer[i]=MathAbs(PlusDiBuffer[i]-MinusDiBuffer[i]) / div;
      i--;
     }
//---- ADX is exponential moving average on DX
   for(i=0; i<limit; i++) {
      ADXBuffer[i]=iMAOnArray(TempBuffer,0,ADXPeriod,0,MODE_EMA,i) * 100.0;
      PlusDiBuffer[i] = PlusDiBuffer[i] * 100.0;
      MinusDiBuffer[i] = MinusDiBuffer[i] * 100.0;
   }
//----
   return(0);
  }
//+------------------------------------------------------------------+
Comments