adx_v1
Download script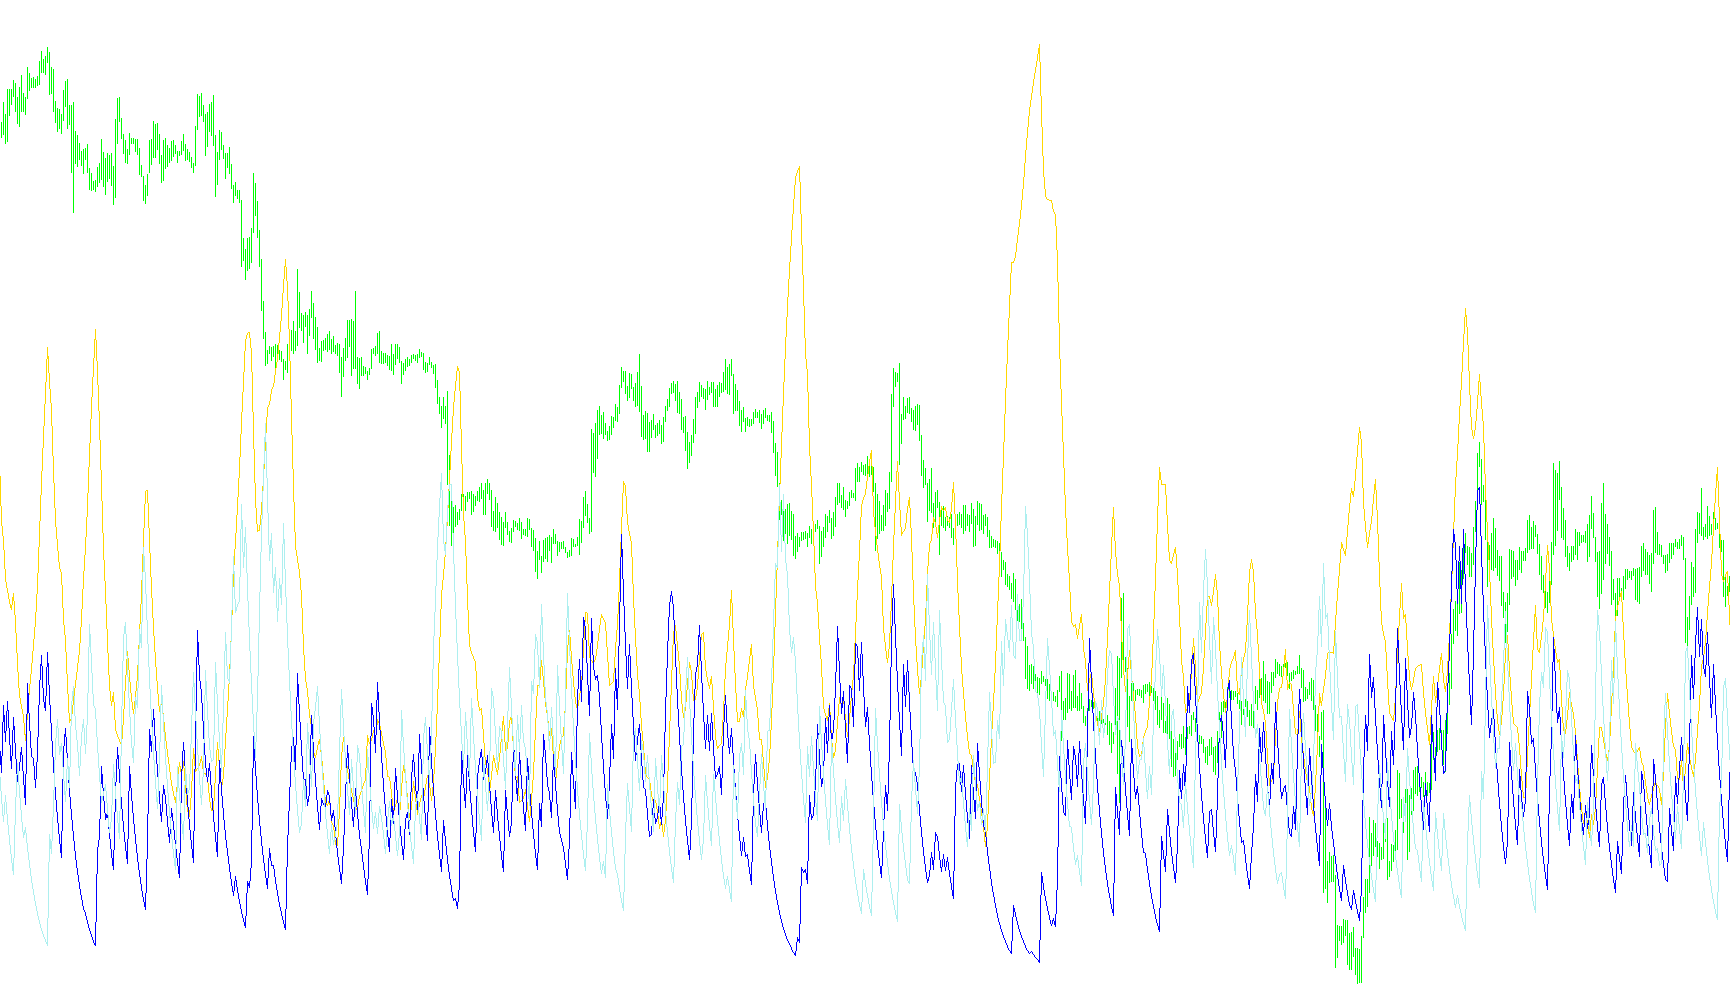
This script is a financial analysis tool designed to measure market trend strength and direction. It operates by calculating three primary components to help traders understand if the market is moving with conviction or simply fluctuating sideways.
Core Functionality
The logic follows a multi-step process to transform raw price data (highs, lows, and closing prices) into smoothed visual indicators:
1. Identifying Directional Movement The tool first looks at each individual candle to determine if the price moved higher or lower compared to the previous period.
- It calculates the "Plus" movement (upward pressure) and "Minus" movement (downward pressure).
- It filters out insignificant movements—for example, if the upward move is smaller than the downward move, it ignores the upward progress. This ensures the tool only captures dominant price action.
2. Calculating Relative Strength (+DI and -DI) Once the upward and downward movements are isolated, the script compares them against the total range of price movement (True Range).
- It converts these movements into percentage values.
- These results produce two separate indicators: +DI (measuring upward strength) and -DI (measuring downward strength).
- To make these lines smooth and readable, the script applies an Exponential Moving Average (EMA), which reduces "noise" and helps highlight the underlying trend.
3. Determining Trend Intensity (DX and ADX) After identifying the direction via +DI and -DI, the script calculates the DX (Directional Index). This represents the difference between upward and downward strength as a percentage of the total movement.
- If +DI is much higher than -DI, it indicates a strong bullish trend.
- If -DI is much higher than +DI, it indicates a strong bearish trend.
- If they are close to each other, it suggests a range-bound or choppy market.
Finally, the script applies one last smoothing pass (another EMA) to the DX calculation to produce the ADX.
Summary of Results
- +DI and -DI Lines: These tell you the direction of the market. When one line is significantly above the other, it shows which way the price is leaning.
- ADX Line: This tells you the strength of that direction. A rising ADX indicates that the current trend (whether up or down) is gaining momentum, while a falling ADX suggests the market is losing steam or becoming undecided.
/*-----------------------------+
|			       |
| Shared by www.Aptrafx.com    |
|			       |
+------------------------------*/

//+------------------------------------------------------------------+
//|                                                          ADX.mq4 |
//|                      Copyright © 2004, MetaQuotes Software Corp. |
//|                                       http://www.metaquotes.net/ |
//+------------------------------------------------------------------+
#property copyright "Copyright © 2004, MetaQuotes Software Corp."
#property link      "http://www.metaquotes.net/"

#property indicator_separate_window
#property indicator_buffers 3
#property indicator_color1 LightSeaGreen
#property indicator_color2 YellowGreen
#property indicator_color3 Wheat
//---- input parameters
extern int ADXPeriod=14;
//---- buffers
double ADXBuffer[];
double PlusDiBuffer[];
double MinusDiBuffer[];
double PlusSdiBuffer[];
double MinusSdiBuffer[];
double TempBuffer[];
//+------------------------------------------------------------------+
//| Custom indicator initialization function                         |
//+------------------------------------------------------------------+
int init()
  {
//---- 3 additional buffers are used for counting.
   IndicatorBuffers(6);
//---- indicator buffers
   SetIndexBuffer(0,ADXBuffer);
   SetIndexBuffer(1,PlusDiBuffer);
   SetIndexBuffer(2,MinusDiBuffer);
   SetIndexBuffer(3,PlusSdiBuffer);
   SetIndexBuffer(4,MinusSdiBuffer);
   SetIndexBuffer(5,TempBuffer);
//---- name for DataWindow and indicator subwindow label
   IndicatorShortName("ADX("+ADXPeriod+")");
   SetIndexLabel(0,"ADX");
   SetIndexLabel(1,"+DI");
   SetIndexLabel(2,"-DI");
//----
   SetIndexDrawBegin(0,ADXPeriod);
   SetIndexDrawBegin(1,ADXPeriod);
   SetIndexDrawBegin(2,ADXPeriod);
//----
   return(0);
  }
//+------------------------------------------------------------------+
//| Average Directional Movement Index                               |
//+------------------------------------------------------------------+
int start()
  {
   double pdm,mdm,tr;
   double price_high,price_low;
   int    starti,i,counted_bars=IndicatorCounted();
//----
   i=Bars-2;
   PlusSdiBuffer[i+1]=0;
   MinusSdiBuffer[i+1]=0;
   if(counted_bars>=i) i=Bars-counted_bars-1;
   starti=i;
//----
   while(i>=0)
     {
      price_low=Low[i];
      price_high=High[i];
      //----
      pdm=price_high-High[i+1];
      mdm=Low[i+1]-price_low;
      if(pdm<0) pdm=0;  // +DM
      if(mdm<0) mdm=0;  // -DM
      if(pdm==mdm) { pdm=0; mdm=0; }
      else if(pdm<mdm) pdm=0;
           else if(mdm<pdm) mdm=0;
      //---- âû÷èñëÿåì èñòèííûé èíòåðâàë
      double num1=MathAbs(price_high-price_low);
      double num2=MathAbs(price_high-Close[i+1]);
      double num3=MathAbs(price_low-Close[i+1]);
      tr=MathMax(num1,num2);
      tr=MathMax(tr,num3);
      //---- counting plus/minus direction
      if(tr==0) { PlusSdiBuffer[i]=0; MinusSdiBuffer[i]=0; }
      else      { PlusSdiBuffer[i]=100.0*pdm/tr; MinusSdiBuffer[i]=100.0*mdm/tr; }
      //----
      i--;
     }
//---- last counted bar will be recounted
   if(counted_bars>0) counted_bars--;
   int limit=Bars-counted_bars;
//---- apply EMA to +DI
   for(i=0; i<=limit; i++)
      PlusDiBuffer[i]=iMAOnArray(PlusSdiBuffer,Bars,ADXPeriod,0,MODE_EMA,i);
//---- apply EMA to -DI
   for(i=0; i<=limit; i++)
      MinusDiBuffer[i]=iMAOnArray(MinusSdiBuffer,Bars,ADXPeriod,0,MODE_EMA,i);
//---- Directional Movement (DX)
   i=Bars-2;
   TempBuffer[i+1]=0;
   i=starti;
   while(i>=0)
     {
      double div=MathAbs(PlusDiBuffer[i]+MinusDiBuffer[i]);
      if(div==0.00) TempBuffer[i]=0;
      else TempBuffer[i]=100*(MathAbs(PlusDiBuffer[i]-MinusDiBuffer[i])/div);
      i--;
     }
//---- ADX is exponential moving average on DX
   for(i=0; i<limit; i++)
      ADXBuffer[i]=iMAOnArray(TempBuffer,Bars,ADXPeriod,0,MODE_EMA,i);
//----
   return(0);
  }
//+------------------------------------------------------------------+
Comments