00_ZZ_Window
Download script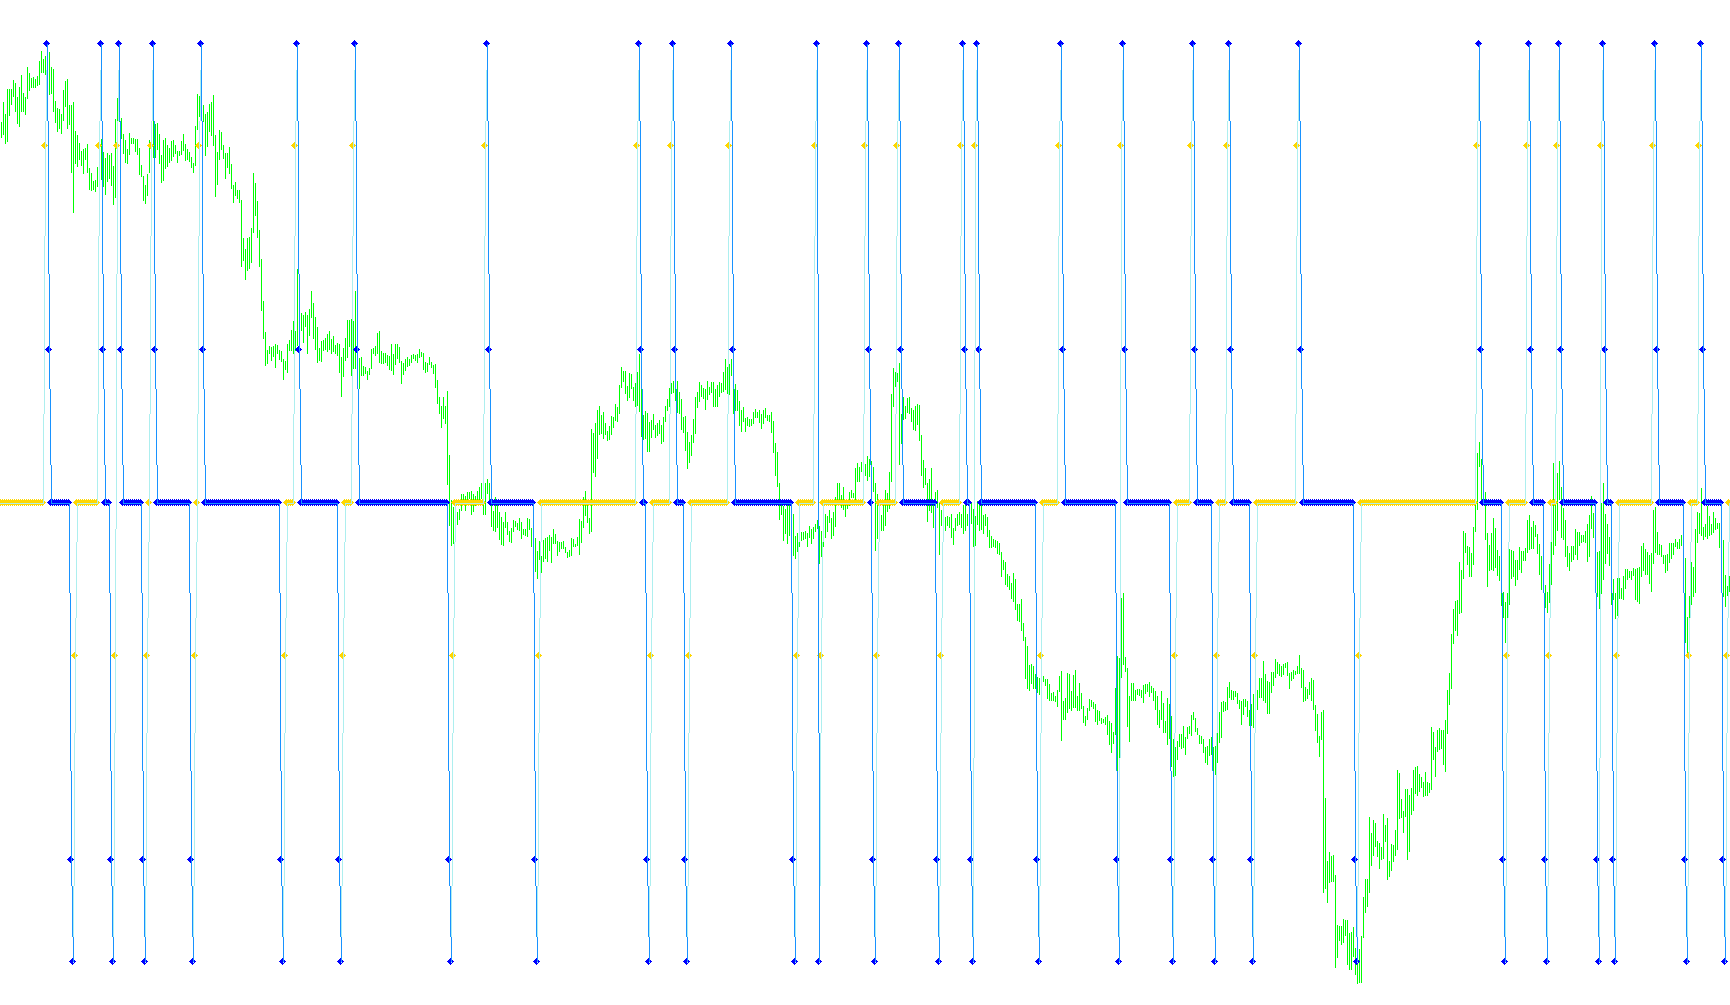
This script functions as a sophisticated technical analysis tool designed to identify structural pivot points and momentum shifts in financial markets. Rather than relying on simple moving averages, it focuses on identifying significant "peaks" (highs) and "valleys" (lows) based on price action relative to a specific look-back window.
Core Logic Overview
The script operates through three distinct phases of data processing:
1. Pivot Point Identification The tool first scans the market history to find local highs and lows. It looks at a set number of previous bars (the "Depth") to determine if a specific price point represents a significant turn. To ensure accuracy, it applies two filters:
- Proximity Filter: It checks how close a price point is to its neighbor to avoid capturing insignificant market noise.
- Backstep Verification: It looks back slightly further to ensure that the identified peak or valley isn't immediately superseded by an even more extreme price point, effectively "cleaning" the data of minor fluctuations.
2. Structural Refinement (The "Cutting" Phase) Once the initial peaks and valleys are found, the script performs a secondary refinement process. It compares consecutive highs and lows against one another. If a new high is discovered that is higher than a previously recorded one in the same sequence, the script "cuts" or removes the older, lower point. This creates a clean structural map of the market's trend, ensuring that only the most significant swing points remain visible.
3. Signal Generation and Visualization In the final phase, the script translates these structural points into actionable visual signals:
- Trend Mapping: It analyzes the relationship between these highs and lows to determine the current momentum of the market.
- Signal Intensity: The tool assigns specific numerical values based on the "strength" of the price action (ranging from -90 to 90). These values are mapped to different visual elements, such as lines and arrows.
- Visual Cues: Depending on whether the market structure indicates a bullish or bearish bias, the script draws distinct shapes and lines on the chart. This provides a clear visual representation of where the trend is shifting, allowing a user to see potential reversals or continuations at a glance.
Summary for the User
Essentially, this script acts as a "noise filter" for price action. It ignores small, insignificant movements and focuses exclusively on the major structural "bones" of the market. By identifying these significant peaks and valleys and refining them into a clean trend map, it provides a visual guide to help you identify where the market is moving and where it might be preparing to turn.
//+------------------------------------------------------------------+
//|                                                                  |
//|                                                                  |
//|                                                                  |
//+------------------------------------------------------------------+
#property copyright "Copyright © 2005, MetaQuotes Software Corp."
#property link      "http://www.metaquotes.net/"

#property indicator_separate_window
#property indicator_minimum -100
#property indicator_maximum 100
#property indicator_buffers 4
#property indicator_color1 Lime
#property indicator_color2 Red
#property indicator_color3 Lime
#property indicator_color4 Red
//---- indicator parameters
extern int ExtDepth=12;
extern int ExtDeviation=5;
extern int ExtBackstep=3;
//---- indicator buffers
double ExtMapBuffer1[];
double ExtMapBuffer2[];
double ExtMapBuffer3[];
double ExtMapBuffer4[];
double ExtMapBuffer5[];
double ExtMapBuffer6[];
double zz[];

//+------------------------------------------------------------------+
//| Custom indicator initialization function                         |
//+------------------------------------------------------------------+
int init()
  {
   IndicatorBuffers(7);
//---- drawing settings
   SetIndexStyle(0,DRAW_ARROW);
   SetIndexArrow(0,119);
   SetIndexBuffer(0,ExtMapBuffer3);
   SetIndexEmptyValue(0,0.0);
   SetIndexStyle(1,DRAW_ARROW);
   SetIndexArrow(1,119);
   SetIndexBuffer(1,ExtMapBuffer4);
   SetIndexEmptyValue(1,0.0);
   SetIndexStyle(2,DRAW_LINE);
   SetIndexBuffer(2,ExtMapBuffer5);
   SetIndexEmptyValue(2,0.0);
   SetIndexStyle(3,DRAW_LINE);
   SetIndexBuffer(3,ExtMapBuffer6);
   SetIndexEmptyValue(3,0.0);
//---- indicator buffers mapping
   SetIndexBuffer(4,ExtMapBuffer1);
   SetIndexBuffer(5,ExtMapBuffer2);
   SetIndexBuffer(6,zz);
   SetIndexEmptyValue(0,0.0);
   SetIndexEmptyValue(1,0.0);
   SetIndexEmptyValue(2,0.0);
   ArraySetAsSeries(ExtMapBuffer1,true);
   ArraySetAsSeries(ExtMapBuffer2,true);
//---- indicator short name
IndicatorShortName("Its life Jim, but not as we know it... ");
//---- initialization done
   return(0);
  }
  int deinit() {return(0);}

//+------------------------------------------------------------------+
//|                                                                  |
//+------------------------------------------------------------------+
int start()
  {
   int    shift, back,lasthighpos,lastlowpos;
   double val,res;
   double curlow,curhigh,lasthigh,lastlow;
   bool signal;
   int i;

   for(shift=Bars-ExtDepth; shift>=0; shift--)
     {
      val=Low[Lowest(NULL,0,MODE_LOW,ExtDepth,shift)];
      if(val==lastlow) val=0.0;
      else
        {
         lastlow=val;
         if((Low[shift]-val)>(ExtDeviation*Point)) val=0.0;
         else
           {
            for(back=1; back<=ExtBackstep; back++)
              {
               res=ExtMapBuffer1[shift+back];
               if((res!=0)&&(res>val)) ExtMapBuffer1[shift+back]=0.0;
              }
           }
        }
      ExtMapBuffer1[shift]=val;
      //--- high
      val=High[Highest(NULL,0,MODE_HIGH,ExtDepth,shift)];
      if(val==lasthigh) val=0.0;
      else
        {
         lasthigh=val;
         if((val-High[shift])>(ExtDeviation*Point)) val=0.0;
         else
           {
            for(back=1; back<=ExtBackstep; back++)
              {
               res=ExtMapBuffer2[shift+back];
               if((res!=0)&&(res<val)) ExtMapBuffer2[shift+back]=0.0;
              }
           }
        }
      ExtMapBuffer2[shift]=val;
     }

   // final cutting
   lasthigh=-1; lasthighpos=-1;
   lastlow=-1;  lastlowpos=-1;

   for(shift=Bars-ExtDepth; shift>=0; shift--)
     {
      curlow=ExtMapBuffer1[shift];
      curhigh=ExtMapBuffer2[shift];
      if((curlow==0)&&(curhigh==0)) continue;
      //---
      if(curhigh!=0)
        {
         if(lasthigh>0)
           {
            if(lasthigh<curhigh) ExtMapBuffer2[lasthighpos]=0;
            else ExtMapBuffer2[shift]=0;
           }
         //---
         if(lasthigh<curhigh || lasthigh<0)
           {
            lasthigh=curhigh;
            lasthighpos=shift;
           }
         lastlow=-1;
        }
      //----
      if(curlow!=0)
        {
         if(lastlow>0)
           {
            if(lastlow>curlow) ExtMapBuffer1[lastlowpos]=0;
            else ExtMapBuffer1[shift]=0;
           }
         //---
         if((curlow<lastlow)||(lastlow<0))
           {
            lastlow=curlow;
            lastlowpos=shift;
           }
         lasthigh=-1;
        }
     }

   for(shift=Bars-1; shift>=0; shift--)
     {
      if(shift>=Bars-ExtDepth) {ExtMapBuffer1[shift]=0.0;ExtMapBuffer2[shift]=0.0;}
      else
        {
         if (ExtMapBuffer1[shift]>0) {signal=true;}
         res=ExtMapBuffer2[shift];
         if(res!=0.0) {ExtMapBuffer1[shift]=res;signal=false;}
        }
        if (signal)
          {
           zz[shift]=-1;
          }
        else
          {
           zz[shift]=1;
          }
     }

// âûâîä

   for(shift=Bars-4; shift>=0; shift--)
     {
      if (zz[shift]<0)
        {

         if (zz[shift+2]>0)
           {
            if (zz[shift+1]>0)
              {
               ExtMapBuffer4[shift+1]=-70;
               ExtMapBuffer6[shift+1]=-70;
               ExtMapBuffer4[shift]=-90;
               ExtMapBuffer6[shift]=-90;
               ExtMapBuffer3[shift]=-90;
               ExtMapBuffer5[shift]=-90;
              }
            else
              {
               ExtMapBuffer3[shift]=-30;
               ExtMapBuffer5[shift]=-30;
              }
           }
         else
           {
            if (zz[shift+1]>0)
              {
               ExtMapBuffer3[shift]=-90;
               ExtMapBuffer5[shift]=-90;
               ExtMapBuffer4[shift]=-90;
               ExtMapBuffer6[shift]=-90;
              }
            else
              {
               ExtMapBuffer3[shift]=0.001;
               ExtMapBuffer5[shift]=0.001;
              }
           }

        }
      else
        {
         if (zz[shift+2]>0)
           {
            if (zz[shift+1]>0)
              {
               ExtMapBuffer4[shift]=0.001;
               ExtMapBuffer6[shift]=0.001;
              }
            else
              {
               ExtMapBuffer3[shift]=90;
               ExtMapBuffer5[shift]=90;
               ExtMapBuffer4[shift]=90;
               ExtMapBuffer6[shift]=90;
              }
           }
         else
           {
            if (zz[shift+1]>0)
              {
               ExtMapBuffer4[shift]=30;
               ExtMapBuffer6[shift]=30;
              }
            else
              {
               ExtMapBuffer3[shift+1]=70;
               ExtMapBuffer5[shift+1]=70;
               ExtMapBuffer3[shift]=90;
               ExtMapBuffer5[shift]=90;
               ExtMapBuffer4[shift]=90;
               ExtMapBuffer6[shift]=90;
              }
           }
        }

     }
  }
Comments