T3MAopt_v1
Download script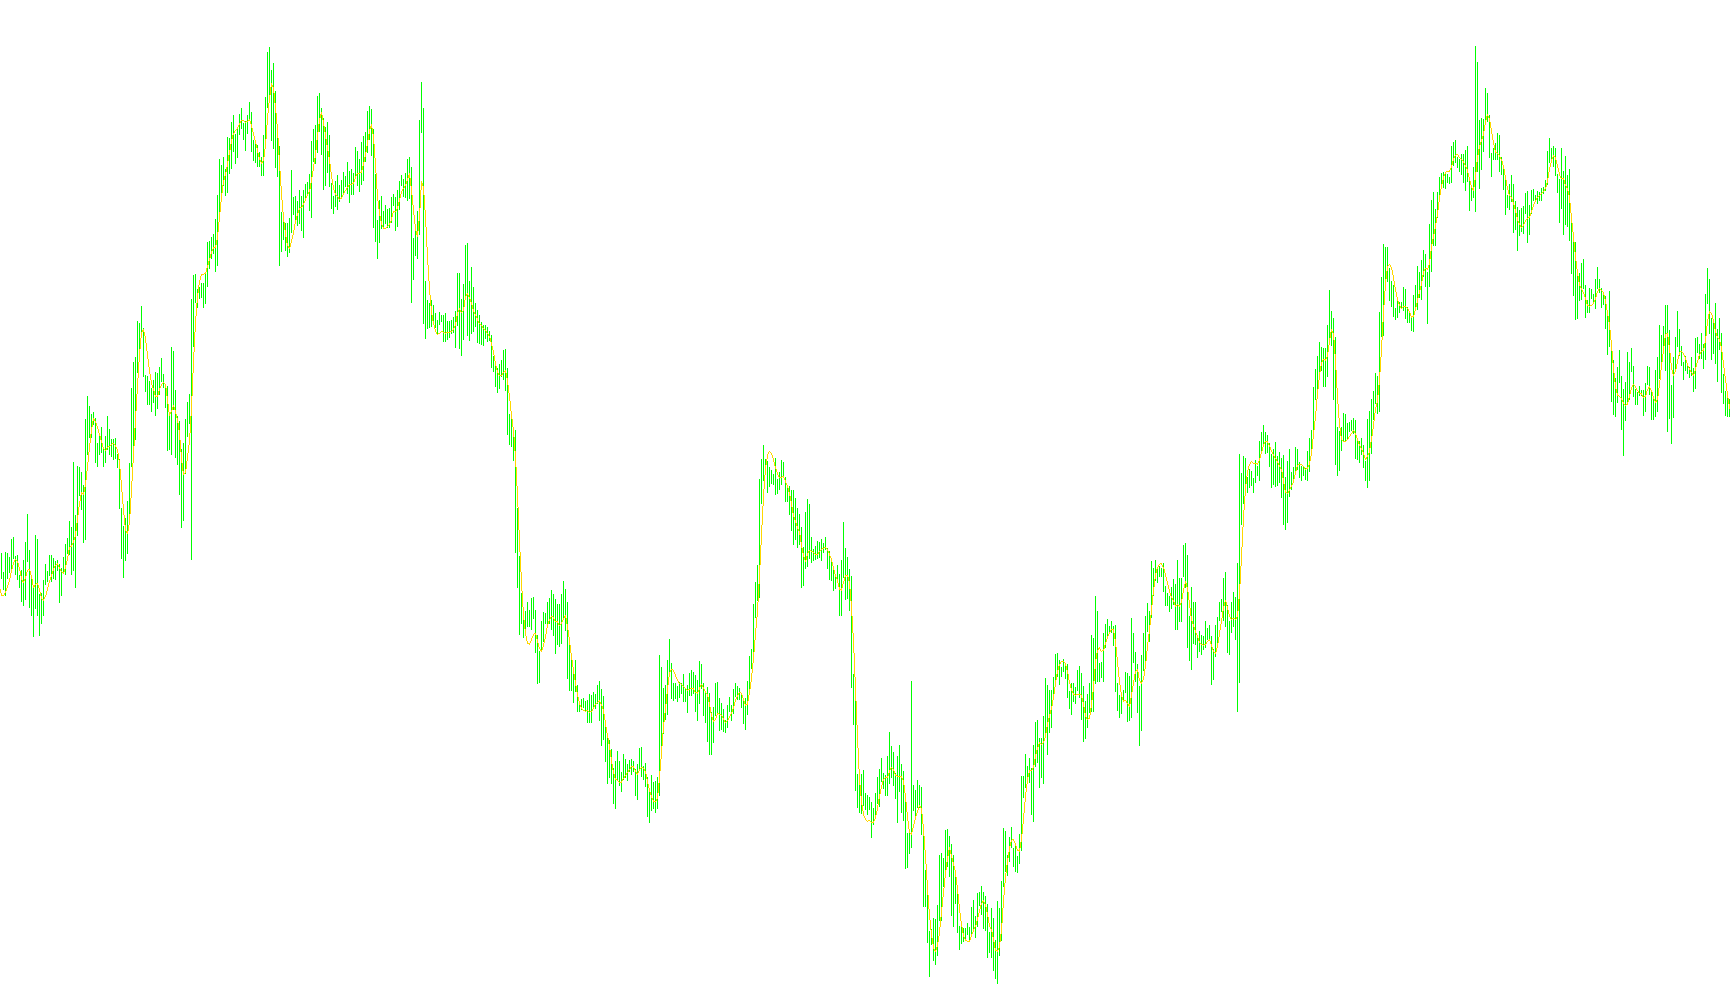
The T3MAopt script is a sophisticated technical analysis tool designed to provide smoother, more accurate price trend data on your trading charts. While standard moving averages can often be "laggy" (reacting too slowly to price changes) or "noisy" (reacting too quickly to minor fluctuations), this specific indicator utilizes a specialized mathematical formula known as the T3 technique.
Core Logic and Methodology
The primary goal of this script is to filter out market noise while maintaining a high level of responsiveness. It achieves this through a multi-layered smoothing process:
1. Multi-Stage Filtering Instead of calculating a single average, the script processes the price data through six successive layers of calculation. Each layer takes the result of the previous one and applies a weighted average. Think of this like a series of filters: each filter refines the data further, removing "jitter" from the price movements so that only the significant trend remains visible.
2. The T3 Weighted Calculation Once the six layers of data are established, the script applies a unique weighting system. It assigns specific mathematical coefficients to these layers based on an amplification factor. This allows the indicator to:
- Prioritize more recent price data to ensure it stays relevant to current market conditions.
- Balance that responsiveness against the smoothed historical data to prevent the line from swinging wildly during minor price spikes.
3. User Customization The logic is built around two primary variables that allow you to tailor the visual output to different trading styles:
- Fast Period: This determines the base window for the moving average, dictating how much historical data is considered at once.
- Calculation Constants: The script uses fixed internal ratios to ensure the "Aqua" colored line on your chart represents a balanced, high-quality trend signal that is easier for the human eye to interpret than raw price action.
Summary of Behavior
When you apply this script to a chart, it translates complex market volatility into a clean, fluid line. It is designed for traders who need a reliable visual guide of price direction—providing a "smoothed" perspective that ignores temporary market distractions while still highlighting the core momentum of the asset.
//+------------------------------------------------------------------+
//|                                                      T3MAopt.mq4 |
//|                                     Copyright © 2005, Nick Bilak |
//|                                        http://www.forex-tsd.com/ |
//+------------------------------------------------------------------+
#property copyright "Copyright © 2005, Nick Bilak"
#property link      "http://www.forex-tsd.com/"

//---- indicator settings
#property  indicator_chart_window
#property  indicator_buffers 1
#property  indicator_color1  Aqua

/*
Overview
T3 is an excellent data-fitting technique by Tim Tillson (cf. ``Smoothing Techniques For More Accurate Signals'' in Technical Analysis of Stocks and Commodities - January 1998)

Calculation
N is the Exponential Moving Average Period a is the amplification percentage of the filter's response to price movement (0 < a < 1)

Close1 = N-days EMA of Close Prices
Close3 = N-days EMA of Close2
Close3 = N-days EMA of Close2
Close4 = N-days EMA of Close3
Close5 = N-days EMA of Close4
Close6 = N-days EMA of Close5

c1 = (-a)^3
c2 = 3 * a^2
c3 = - 6 * a^2 - 3 * a - 3 * a^3
c4 = 1 + 3 * a + a^3 + 3 * a^2

T3 = c1 * Close6 + c2 * Close5 + c3 * Close4 + c4 * Close3

Parameters
The default values are : N = 5 a = 0.7

Examples
GT::Indicators::T3->new() GT::Indicators::T3->new([5, 0.7])

*/

//---- indicator parameters
extern int FastMA_Period=4;
extern int SlowMA_Period=6;

double Close1,Close2,Close3,Close4,Close5,Close6;

//---- indicator buffers
double FastMABuffer[];

//+------------------------------------------------------------------+
//| Custom indicator initialization function                         |
//+------------------------------------------------------------------+
int init()
  {
   IndicatorBuffers(1);

//---- drawing settings
   SetIndexStyle(0,DRAW_LINE);
   SetIndexDrawBegin(0,FastMA_Period);
   if( !SetIndexBuffer(0,FastMABuffer) )
      Print("cannot set indicator buffers!");

//---- name for DataWindow and indicator subwindow label
   IndicatorShortName("T3MAopt("+FastMA_Period+")");
   Comment("T3MAopt("+FastMA_Period+")");

//---- initialization done
   return(0);

  }
//+------------------------------------------------------------------+
//| Moving Average of Oscillator                                     |
//+------------------------------------------------------------------+
int start() {

   int i,limit;
   int counted_bars=IndicatorCounted();

//---- check for possible errors
   if(counted_bars<0) return(-1);
//---- last counted bar will be recounted
   if(counted_bars>0) counted_bars--;
   limit=Bars-FastMA_Period-1-counted_bars;

//---- main loop

	double a=0.8;
	double c1=-a*a*a;
	double c2=3*a*a+3*a*a*a;
	double c3=-6*a*a-3*a-3*a*a*a;
	double c4=1+3*a+a*a*a+3*a*a;

   double pr=2.0/(FastMA_Period+1);
   Close1=Close[limit+1];
   Close2=Close1;
   Close3=Close2;
   Close4=Close3;
   Close5=Close4;
   Close6=Close5;
   for(i=limit; i>=0; i--) {
   	Close1=Close[i]*pr+Close1*(1-pr);
      Close2=Close1*pr+Close2*(1-pr);
      Close3=Close2*pr+Close3*(1-pr);
      Close4=Close3*pr+Close4*(1-pr);
      Close5=Close4*pr+Close5*(1-pr);
      Close6=Close5*pr+Close6*(1-pr);
   	FastMABuffer[i]=c1*Close6+c2*Close5+c3*Close4+c4*Close3;
   }

//---- done
   return(0);
}
//+------------------------------------------------------------------+
Comments