Triggerlines1_v2
Download script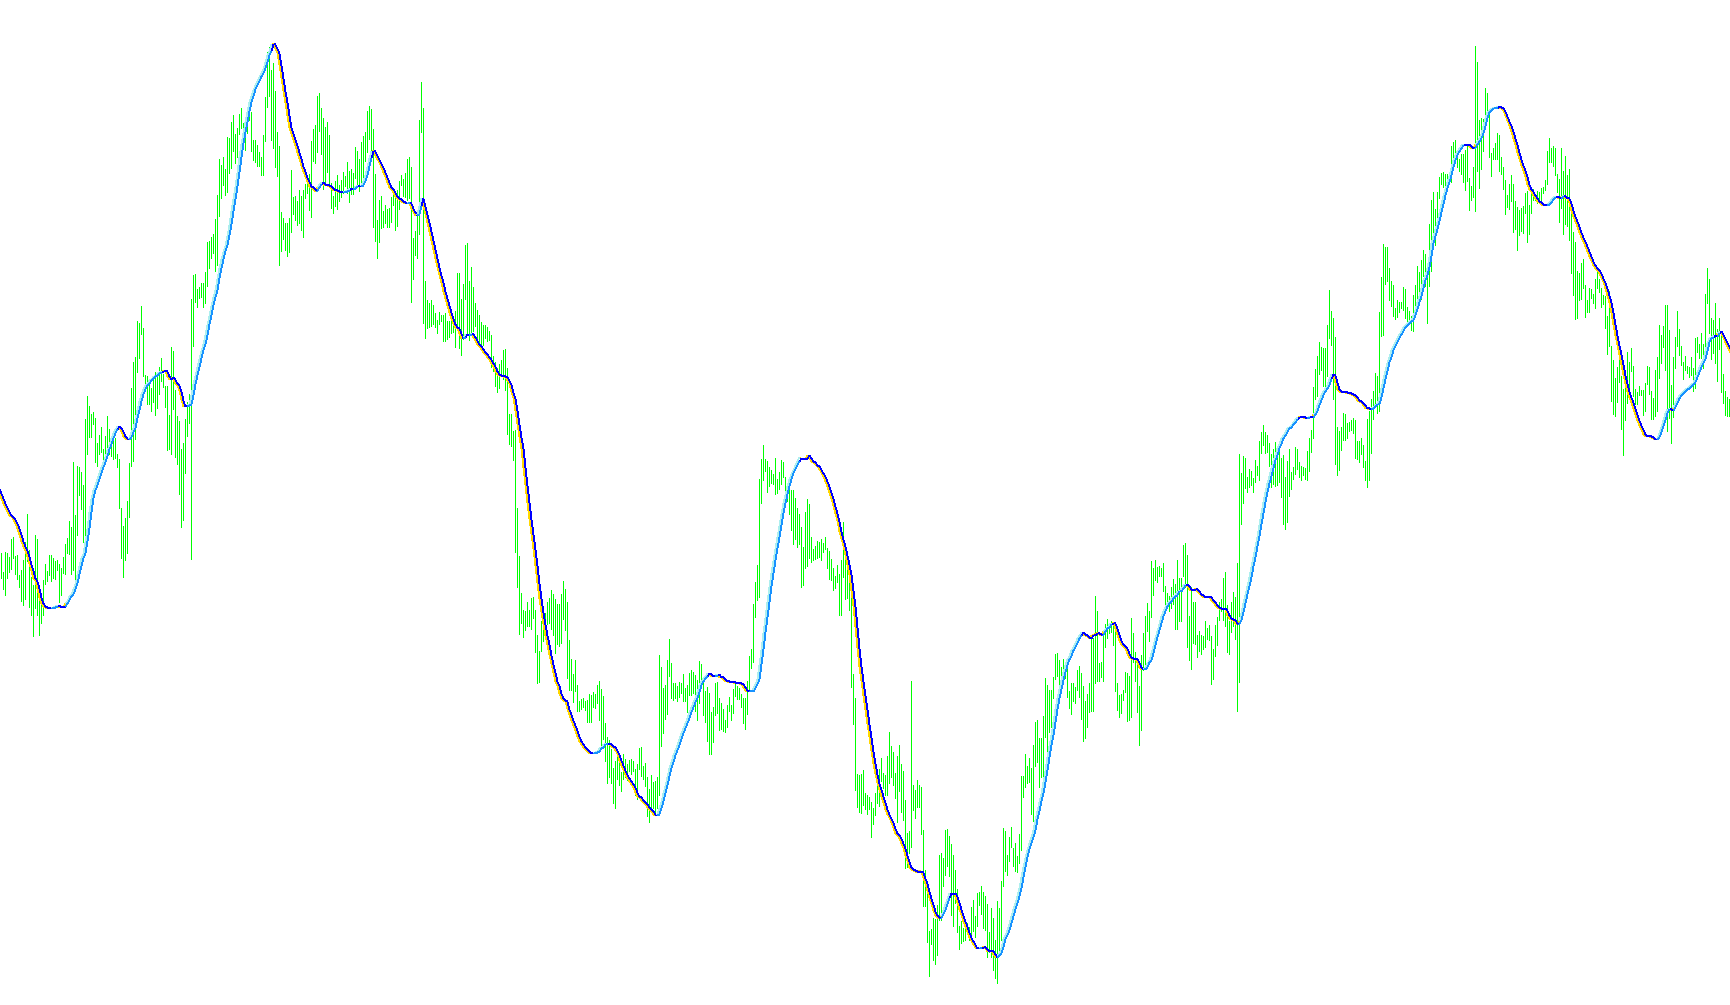
This technical tool is designed to provide visual signals on a trading chart by calculating and comparing two distinct types of moving averages. Its primary purpose is to identify specific momentum shifts by highlighting when one trend line crosses above another.
Core Methodology
The script processes historical price data to generate two separate data streams:
- The Weighted Average: The tool calculates a weighted average where the weight assigned to each price point increases as it gets closer to the current time. Unlike a simple average that treats all past prices equally, this logic gives more importance to recent price action, making it more responsive to sudden market changes.
- The Linear Smoothed Average: The tool then takes that weighted data and applies an additional layer of smoothing (a linear smoothing technique). This creates a "buffer" line that is less volatile and moves more slowly than the primary weighted average.
Visual Logic and Signal Generation
The indicator plots both of these lines on your chart simultaneously to show the relationship between short-term momentum and long-term trends:
- Trend Tracking: By observing how these two lines interact, traders can see the "velocity" of the market. When the weighted line is above the smoothed line, it indicates positive momentum; when it falls below, it suggests a downward trend.
- Dynamic Highlighting: The script features a specific filtering logic to make signals clearer. It is programmed to only display certain colored lines when the weighted average is higher than the smoothed average.
- Signal Filtering: If the weighted average drops below the smoothed average, the script "hides" specific components of the visual data (setting them to empty values). This helps clean up the chart by removing visual noise during unfavorable market conditions, allowing you to focus solely on the periods where the momentum meets your desired criteria.
In summary, this script acts as a momentum filter that smooths out market "noise" to help you visualize exactly when short-term price movement gains enough strength to break away from the established trend.
Miscellaneous
16
Views
0
Downloads
0
Favorites
Triggerlines1_v2
//+------------------------------------------------------------------+
//|                                                     Trigger Line |
//|                             Copyright © 2005 dwt5 and adoleh2000 |
//|                                        http://www.metaquotes.net |
//+------------------------------------------------------------------+
#property  copyright "Copyright © 2005 dwt5 and adoleh2000 "
#property  link      "http://www.metaquotes.net/"

//---- indicator settings
#property  indicator_chart_window
#property  indicator_buffers 4
#property indicator_color1 Yellow
#property indicator_color2 Orange
#property indicator_color3 Aqua
#property indicator_color4 Blue

//---- buffers
double ExtMapBuffer1[];
double ExtMapBuffer2[];
double ExtMapBuffer3[];
double ExtMapBuffer4[];

int width;

extern int Rperiod = 50;
extern int LSMA_Period = 50;
int Draw4HowLong;
int shift;
int i;
int j;
int loopbegin;
int length;
int lsma_length;

double lengthvar;
double tmp ;
double tmp2 ;
double wt[];
double sum[];
double lsma_sum[];
double lsma_ma[];
double middle[];
int c;

//+------------------------------------------------------------------+
//| Custom indicator initialization function                         |
//+------------------------------------------------------------------+
int init()
  {
//---- 7 additional buffers are used for counting.
   IndicatorBuffers(7);

//---- drawing settings

   SetIndexBuffer(0,ExtMapBuffer1);
   SetIndexStyle(0,DRAW_LINE,STYLE_SOLID,2);

   SetIndexBuffer(1,ExtMapBuffer2);
   SetIndexStyle(1,DRAW_LINE,STYLE_SOLID,2);

   SetIndexBuffer(2,ExtMapBuffer3);
   SetIndexStyle(2,DRAW_LINE,STYLE_SOLID,2);

   SetIndexBuffer(3,ExtMapBuffer4);
   SetIndexStyle(3,DRAW_LINE,STYLE_SOLID,2);


   SetIndexBuffer(4,sum);
   SetIndexBuffer(5,wt);
   SetIndexBuffer(6,lsma_ma);

//---- initialization done
   return(0);
  }

int start()

  {   Draw4HowLong = Bars-Rperiod - 5;                            //Rperiod = 20
      length = Rperiod;                                           //length now = 20
      lsma_length = LSMA_Period;
      loopbegin = Draw4HowLong - length - 1;


      for(shift = loopbegin; shift >= 0; shift--)  //  MAIN For Loop
      {
         sum[1] = 0;
         for(i = length; i >= 1  ; i--)             //LSMA loop
         {
         lengthvar = length + 1;                               //lengthvar = 21
         lengthvar /= 3;                                       //lengthvar = 7
         tmp = 0;
         tmp = ( i - lengthvar)*Close[length-i+shift];         //tmp = 20 - 7 * close[20-i+shift]
         sum[1]+=tmp;
         }
         wt[shift] = sum[1]*6/(length*(length+1));
         j = shift;
         lsma_ma[shift] = wt[j+1] + (wt[j]-wt[j+1])* 2/(lsma_length+1);


//========== COLOR CODING ===========================================


            ExtMapBuffer1[shift] = wt[shift];
            ExtMapBuffer2[shift] = lsma_ma[shift];
            ExtMapBuffer3[shift] = wt[shift];
            ExtMapBuffer4[shift] = lsma_ma[shift];


            if (wt[shift]  < lsma_ma[shift])
            {
                ExtMapBuffer4[shift] = EMPTY_VALUE;
                ExtMapBuffer3[shift] = EMPTY_VALUE;
           }

        }
  }
//+------------------------------------------------------------------+
Comments