TriggerLine-mod
Download script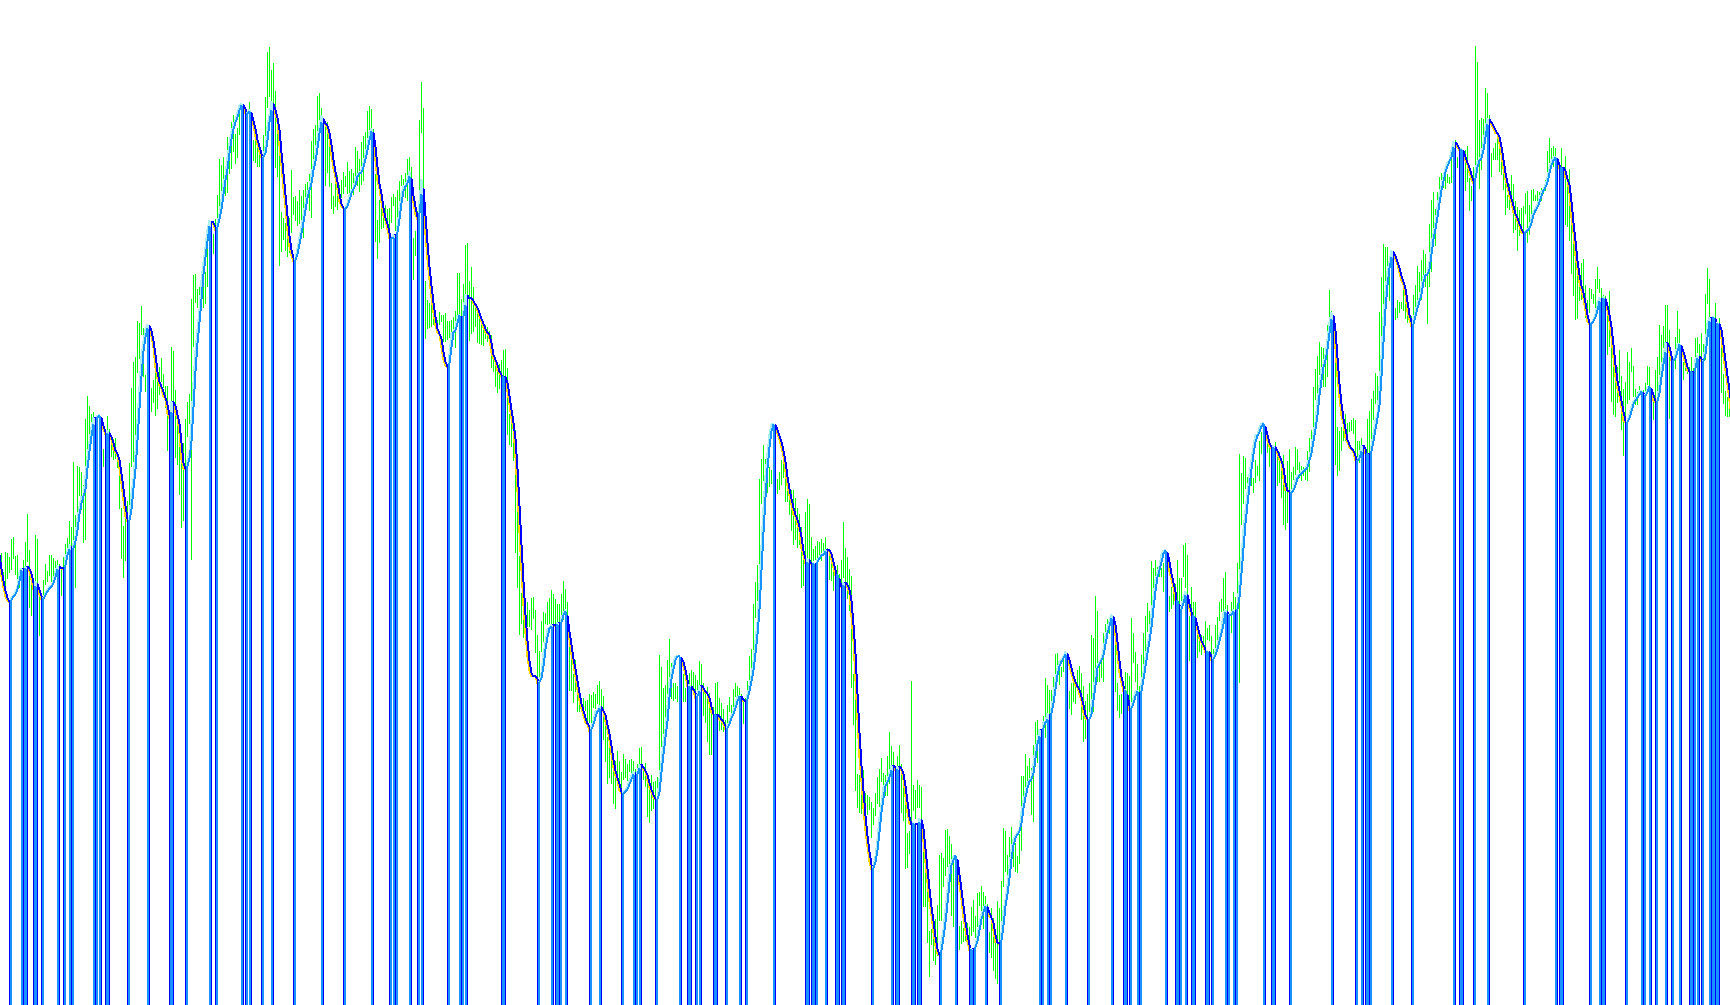
Overview
The Trigger Line is a technical analysis tool designed to provide visual cues on a price chart by identifying specific momentum and trend transitions. It functions by calculating two distinct mathematical layers: a weighted moving average and a smoothed trend line. By comparing these two values, the script highlights shifts in market sentiment, allowing traders to distinguish between different types of price movements.
How the Logic Works
The tool operates through three primary stages of calculation:
1. Weighted Price Analysis
Instead of treating every past price point equally, the script applies a "weighting" logic to historical data. It prioritizes recent price actions over older ones. This ensures that the resulting data reflects what is happening in the market right now rather than being heavily influenced by outdated information from many candles ago.
2. Trend Smoothing (LSMA)
The script then applies a secondary layer of smoothing, known as a Least Squares Moving Average (LSMA) logic. While the first step identifies weighted momentum, this second step refines that data to create a smoother trend line. This helps filter out "market noise"—the small, insignificant fluctuations in price—to reveal the underlying direction of the trend.
3. The Trigger Mechanism
The core functionality of the script lies in the interaction between these two calculated lines:
- Momentum Tracking: When the weighted momentum sits below the smoothed trend line, the script signals one specific market state (visualized in red).
- Trend Confirmation: When the weighted momentum crosses above the smoothed trend line, the script switches to signal a different market state (visualized in blue).
Visual Summary for Traders
The script simplifies complex mathematical calculations into a clear visual experience. Rather than showing all the raw data at once, it uses a "switching" logic. It only displays the specific lines relevant to the current trend direction. When the relationship between the weighted momentum and the smoothed average changes, the colors on your chart shift, providing an immediate visual cue of a potential change in market behavior.
//+------------------------------------------------------------------+
//|                                                     Trigger Line |
//|                             Copyright © 2005 dwt5 and adoleh2000 |
//|                                        http://www.metaquotes.net |
//+------------------------------------------------------------------+
#property  copyright "Copyright © 2005 dwt5 and adoleh2000 "
#property  link      "http://www.metaquotes.net/"

//---- indicator settings
#property  indicator_chart_window
#property  indicator_buffers 4
#property indicator_color1 Red
#property indicator_color2 Red
#property indicator_color3 Blue
#property indicator_color4 Blue

//---- buffers
double ExtMapBuffer1[];
double ExtMapBuffer2[];
double ExtMapBuffer3[];
double ExtMapBuffer4[];

int width;

extern int Rperiod = 15;
extern int LSMA_Period = 5;
int Draw4HowLong;
int shift;
int i;
int j;
int loopbegin;
int length;
int lsma_length;

double lengthvar;
double tmp ;
double tmp2 ;
double wt[];
double sum[];
double lsma_sum[];
double lsma_ma[];
double middle[];
int c;

//+------------------------------------------------------------------+
//| Custom indicator initialization function                         |
//+------------------------------------------------------------------+
int init()
  {
//---- 7 additional buffers are used for counting.
   IndicatorBuffers(7);

//---- drawing settings

   SetIndexBuffer(0,ExtMapBuffer1);
   SetIndexStyle(0,DRAW_LINE,STYLE_SOLID,2);

   SetIndexBuffer(1,ExtMapBuffer2);
   SetIndexStyle(1,DRAW_LINE,STYLE_SOLID,2);

   SetIndexBuffer(2,ExtMapBuffer3);
   SetIndexStyle(2,DRAW_LINE,STYLE_SOLID,2);

   SetIndexBuffer(3,ExtMapBuffer4);
   SetIndexStyle(3,DRAW_LINE,STYLE_SOLID,2);


   SetIndexBuffer(4,sum);
   SetIndexBuffer(5,wt);
   SetIndexBuffer(6,lsma_ma);

//---- initialization done
   return(0);
  }

int start()

  {   Draw4HowLong = Bars-Rperiod - 5;                            //Rperiod = 20
      length = Rperiod;                                           //length now = 20
      lsma_length = LSMA_Period;
      loopbegin = Draw4HowLong - length - 1;


      for(shift = loopbegin; shift >= 0; shift--)  //  MAIN For Loop
      {
         sum[1] = 0;
         for(i = length; i >= 1  ; i--)             //LSMA loop
         {
         lengthvar = length + 1;                               //lengthvar = 21
         lengthvar /= 3;                                       //lengthvar = 7
         tmp = 0;
         tmp = ( i - lengthvar)*Close[length-i+shift];         //tmp = 20 - 7 * close[20-i+shift]
         sum[1]+=tmp;
         }
         wt[shift] = sum[1]*6/(length*(length+1));
         j = shift;
         lsma_ma[shift] = wt[j+1] + (wt[j]-wt[j+1])* 2/(lsma_length+1);


//========== COLOR CODING ===========================================


            if (wt[shift]  < lsma_ma[shift])
            {
            ExtMapBuffer1[shift] = wt[shift];
            ExtMapBuffer2[shift] = lsma_ma[shift];
            ExtMapBuffer3[shift] = 0;
            ExtMapBuffer4[shift] = 0;
            }
            if (wt[shift]  > lsma_ma[shift])
            {
            ExtMapBuffer1[shift] = 0;
            ExtMapBuffer2[shift] = 0;
            ExtMapBuffer3[shift] = wt[shift];
            ExtMapBuffer4[shift] = lsma_ma[shift];
            }

        }
  }
//+------------------------------------------------------------------+
Comments