TrendEnvelopes_v2
Download script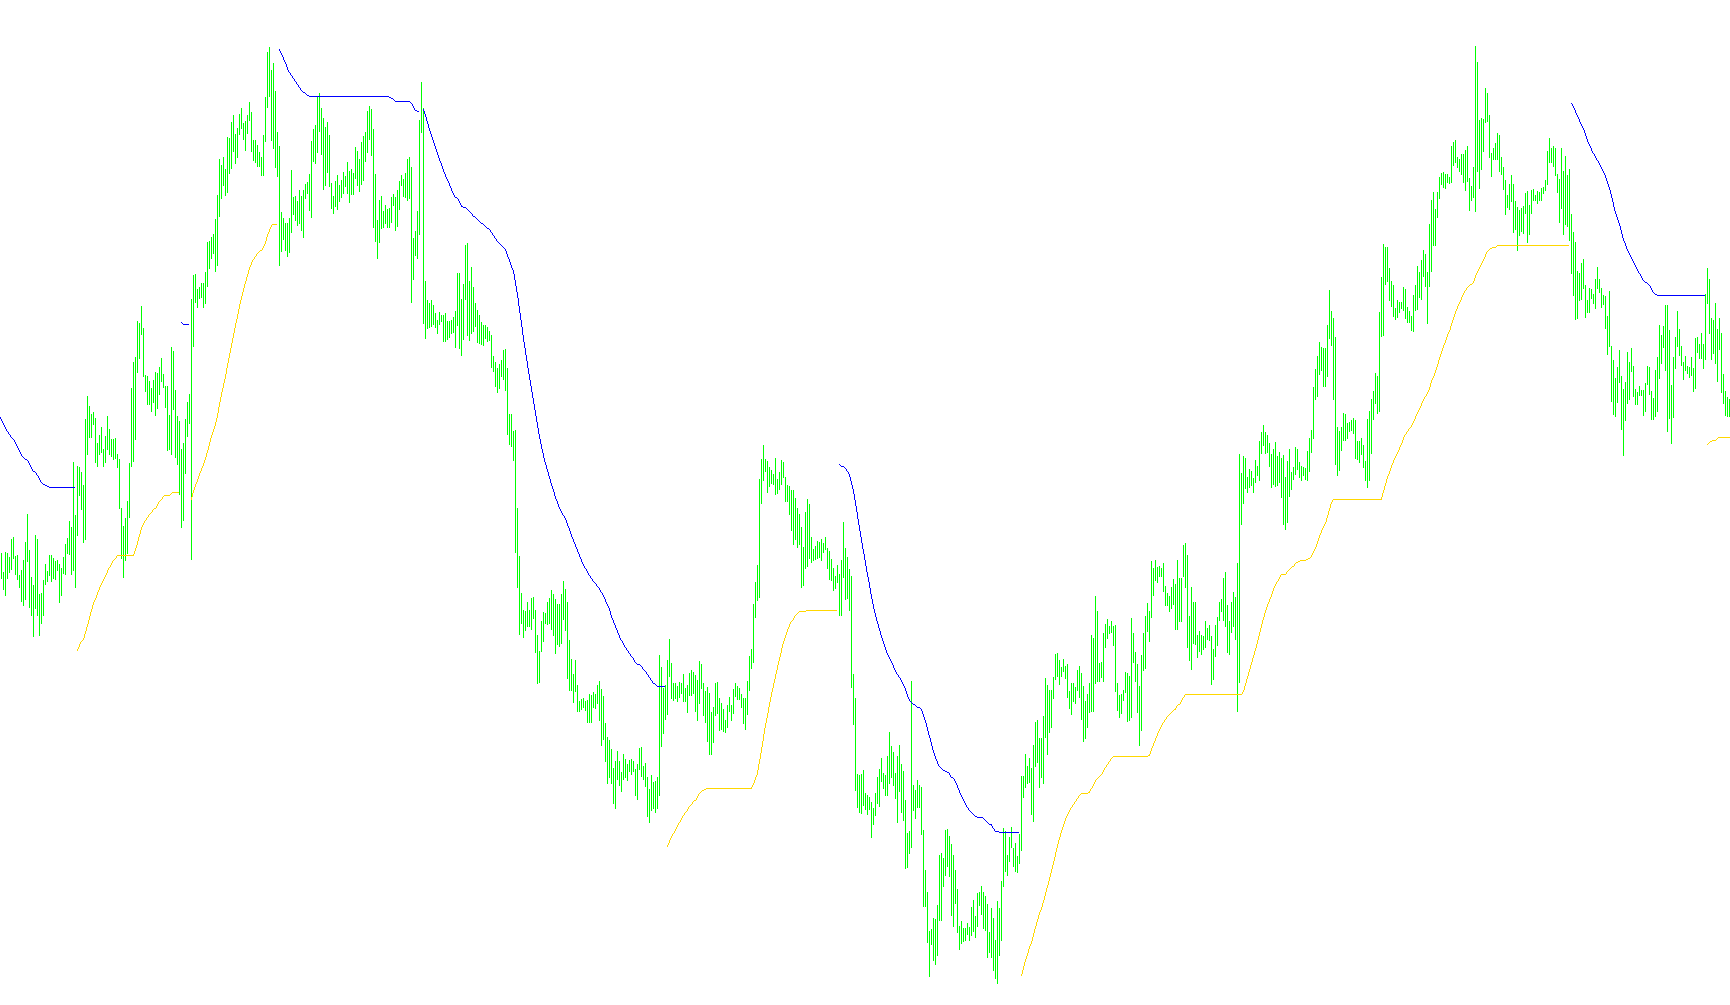
The TrendEnvelopes indicator is designed to help traders identify the prevailing direction of the market and pinpoint potential entry or exit zones based on price momentum. Rather than just following a single moving line, this tool creates a dynamic "envelope" around the price action to differentiate between sustained trends and minor market noise.
Core Logic and Functionality
1. Establishing the Baseline The tool begins by calculating a standard Moving Average (MA). This acts as the "heartbeat" of the market, representing the average price over a specific period. From this baseline, the script calculates an upper and lower boundary based on a user-defined percentage of deviation. This creates a visual channel or "envelope."
2. Trend Identification The system constantly monitors the relationship between the current closing price and these boundaries:
- Bullish Trend: If the price closes above the previous upper boundary, the indicator recognizes an upward trend.
- Bearish Trend: If the price closes below the previous lower boundary, the indicator recognizes a downward trend.
3. Dynamic Envelope Adjustment Unlike static channels, these envelopes are "sticky." When the market is in an uptrend, the lower boundary (the support) tracks the lowest point reached during that move. Conversely, during a downtrend, the upper boundary (the resistance) tracks the highest point reached. This allows the indicator to "stretch" or "contract" naturally with the strength of the market movement, ensuring that the boundaries reflect the actual reality of the price action.
4. Visual Signals and Alerts The script provides clear visual feedback on the chart:
- Trend Lines: It plots distinct lines for the upper and lower envelopes, allowing you to see the current "ceiling" or "floor" of the market.
- Signal Markers: When enabled, the tool can generate specific signals (arrows) when the trend shifts. For example, it can identify a reversal by detecting when the price breaks out of an established trend into the opposite direction, using volatility measurements to ensure the signal is significant enough to be noticed.
Summary for the User
Essentially, this indicator acts as a visual guide for market structure. It filters out "choppy" price action by requiring the price to break through specific boundaries before confirming a new trend. By tracking the extremes of these trends dynamically, it helps traders stay on the right side of the market movement while providing clear visual cues for when that momentum might be changing.
//+------------------------------------------------------------------+
//|                                            TrendEnvelopes_v1.mq4 |
//|                           Copyright © 2006, TrendLaboratory Ltd. |
//|            http://finance.groups.yahoo.com/group/TrendLaboratory |
//|                                   E-mail: igorad2003@yahoo.co.uk |
//+------------------------------------------------------------------+
#property copyright "Copyright © 2006, TrendLaboratory Ltd."
#property link      "http://finance.groups.yahoo.com/group/TrendLaboratory"
//---- indicator settings
#property indicator_chart_window
#property indicator_buffers 4
#property indicator_color1 LightBlue
#property indicator_color2 Orange
#property indicator_width1 2
#property indicator_width2 2
#property indicator_color3 LightBlue
#property indicator_color4 Orange
#property indicator_width3 2
#property indicator_width4 2
//---- indicator parameters
extern int     MA_Period      = 34;
 int     MA_Shift       =  0;
 int     MA_Method      =  3;
 int     Applied_Price  =  0;
 double  Deviation      =0.2;
 int     UseSignal      =  0;
//---- indicator buffers
double UpBuffer[];
double DnBuffer[];
double UpSignal[];
double DnSignal[];
double smax[];
double smin[];
double trend[];

//----
int ExtCountedBars=0;
//+------------------------------------------------------------------+
//| Custom indicator initialization function                         |
//+------------------------------------------------------------------+
int init()
  {
   int    draw_begin;
   string short_name;
//---- drawing settings
   IndicatorBuffers(7);
   SetIndexStyle(0,DRAW_LINE);
   SetIndexShift(0,MA_Shift);
   SetIndexStyle(1,DRAW_LINE);
   SetIndexShift(1,MA_Shift);

   SetIndexStyle(2,DRAW_ARROW);
   SetIndexShift(2,MA_Shift);
   SetIndexArrow(2,233);
   SetIndexStyle(3,DRAW_ARROW);
   SetIndexShift(3,MA_Shift);
   SetIndexArrow(3,234);

   IndicatorDigits(MarketInfo(Symbol(),MODE_DIGITS));
   if(MA_Period<2) MA_Period=14;
   draw_begin=MA_Period-1;
//---- indicator short name
   IndicatorShortName("Env("+MA_Period+")");
   SetIndexLabel(0,"UpTrendEnv");
   SetIndexLabel(1,"DnTrendEnv");
   SetIndexLabel(2,"UpSignal");
   SetIndexLabel(3,"DnSignal");
   SetIndexDrawBegin(0,draw_begin);
   SetIndexDrawBegin(1,draw_begin);
   SetIndexDrawBegin(2,draw_begin);
   SetIndexDrawBegin(3,draw_begin);
   //---- indicator buffers mapping
   SetIndexBuffer(0,UpBuffer);
   SetIndexBuffer(1,DnBuffer);
   SetIndexBuffer(2,UpSignal);
   SetIndexBuffer(3,DnSignal);
   SetIndexBuffer(4,smax);
   SetIndexBuffer(5,smin);
   SetIndexBuffer(6,trend);
   if(Deviation<0.1) Deviation=0.1;
   if(Deviation>100.0) Deviation=100.0;
//---- initialization done
   return(0);
  }
//+------------------------------------------------------------------+
//| Custom indicator iteration function                              |
//+------------------------------------------------------------------+
int start()
  {
   int limit;
   if(Bars<=MA_Period) return(0);
   ExtCountedBars=IndicatorCounted();
//---- check for possible errors
   if (ExtCountedBars<0) return(-1);
//---- last counted bar will be recounted
   if (ExtCountedBars>0) ExtCountedBars--;
   limit=Bars-ExtCountedBars;
//---- EnvelopesM counted in the buffers
   for(int i=limit; i>=0; i--)
     {
      smax[i] = (1+Deviation/100)*iMA(NULL,0,MA_Period,0,MA_Method,Applied_Price,i);
      smin[i] = (1-Deviation/100)*iMA(NULL,0,MA_Period,0,MA_Method,Applied_Price,i);

      trend[i]=trend[i+1];

	   if (Close[i]>smax[i+1])  trend[i]=1;
	   if (Close[i]<smin[i+1])  trend[i]=-1;

	   if(trend[i]>0)
	   {
	   if (smin[i]<smin[i+1]) smin[i]=smin[i+1];
	   UpBuffer[i]=smin[i];
	   if (UseSignal>0)
	   if (trend[i+1]<0) UpSignal[i] = Low[i]-0.5*iATR(NULL,0,MA_Period,i);
	   DnBuffer[i]=EMPTY_VALUE;
	   }
	   else
	   {
	   if(smax[i]>smax[i+1]) smax[i]=smax[i+1];
	   DnBuffer[i]=smax[i];
	   if (UseSignal>0)
	   if (trend[i+1]>0) DnSignal[i] = High[i]+0.5*iATR(NULL,0,MA_Period,i);
	   UpBuffer[i]=EMPTY_VALUE;
	   }
   }
//---- done
   return(0);
  }
//+------------------------------------------------------------------+
Comments