TrendContinuation_v2
Download script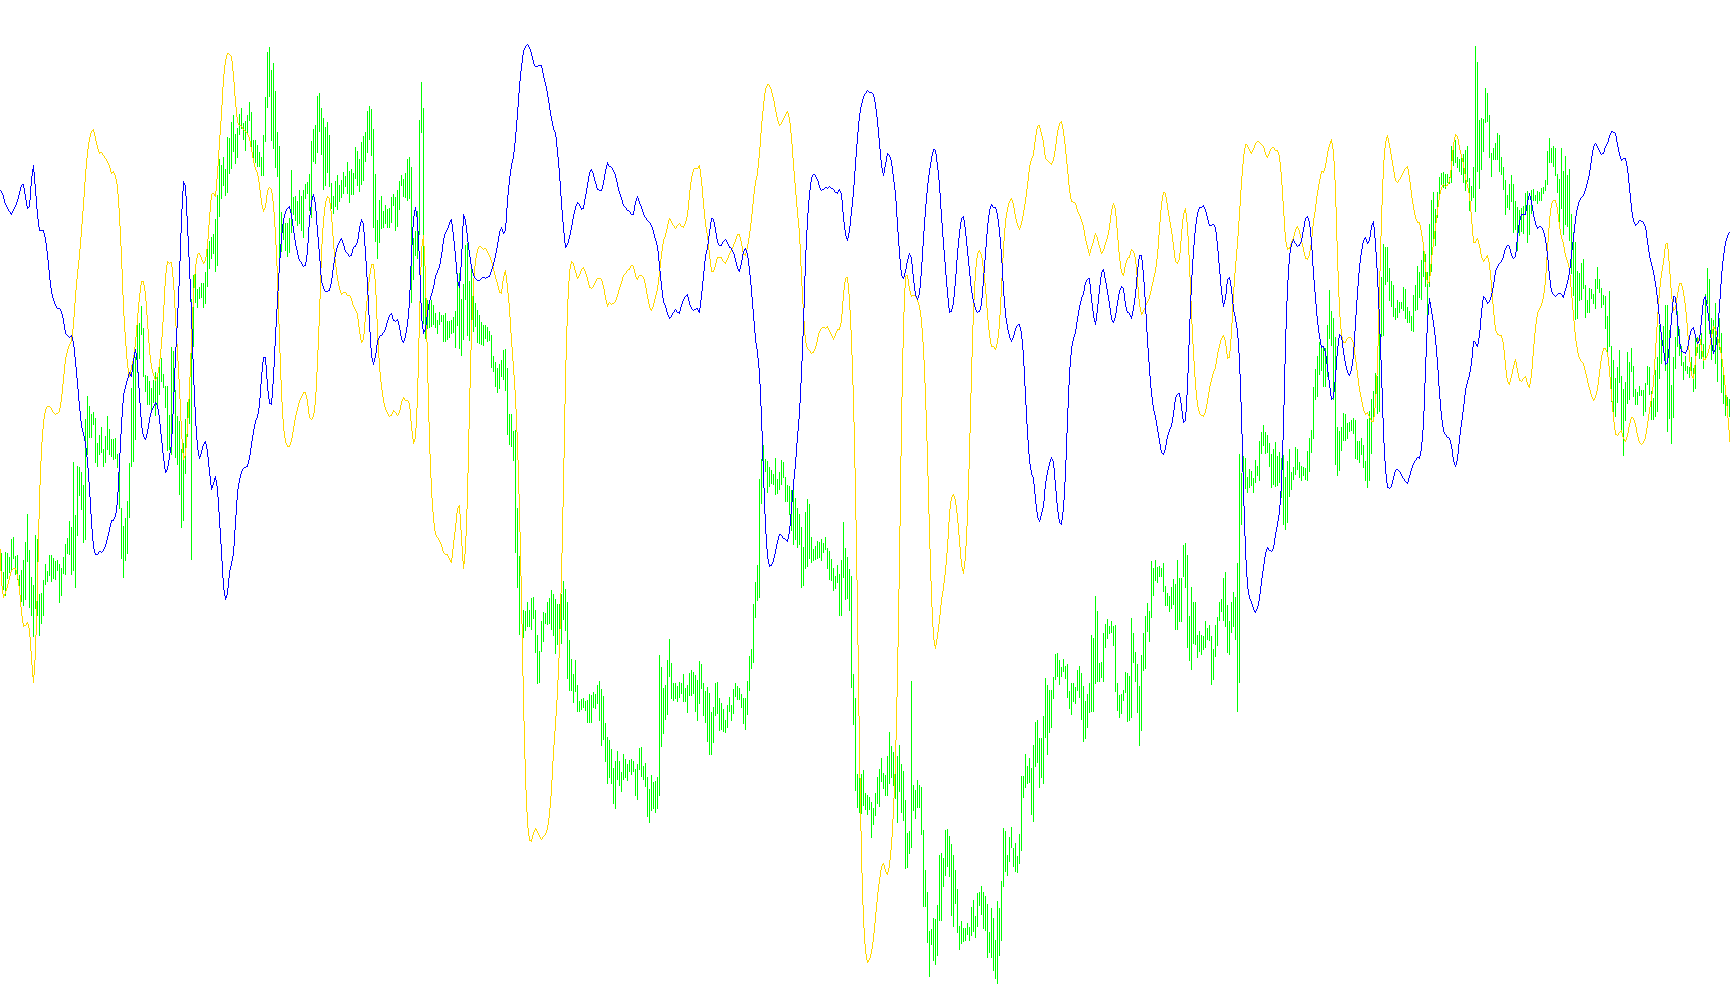
This script is a technical analysis tool designed to help traders identify and visualize momentum trends in financial markets. It works by calculating a "Trend Continuation Factor," which essentially measures how much the current price movement is pushing in one direction versus the opposing force of previous moves.
Here is a breakdown of the logic used by the tool:
Core Concept: Tracking Price Momentum
The indicator focuses on identifying the difference between upward and downward price movements. Instead of just looking at the raw price, it breaks down every price change into two categories:
- Positive Movement: Gains made when the current price is higher than the previous price.
- Negative Movement: Losses sustained when the current price is lower than the previous price.
How the Calculation Works
The tool processes this data through several layers of calculation to filter out "noise" and highlight significant trends:
- Cumulative Tracking: The script maintains a running tally of these gains and losses. It looks at the distance traveled in each direction over a specific period to determine the strength of the current trend.
- Oppositional Analysis: A key feature of this logic is that it doesn't just look at how much the price went up; it subtracts the cumulative downward movement from the upward movement (and vice versa). This helps identify whether a trend is genuinely strong or if it is struggling against significant previous losses.
- Smoothing and Weighting: To prevent the indicator from jumping erratically with every tiny price tick, it uses a mathematical smoothing technique (similar to weighted moving averages). This ensures that the lines displayed on your chart represent fluid trends rather than jagged, unpredictable spikes.
- T3 Filtering: The script employs a specific calculation method known as "T3." This is a sophisticated smoothing algorithm designed to provide a very clean line that reacts quickly to price changes but remains stable enough to follow a trend without producing many false signals.
Visual Output
The indicator produces two separate lines on a separate window below your main chart:
- Blue Line: Represents the Trend Continuation Factor for upward momentum.
- Red Line: Represents the Trend Continuation Factor for downward momentum.
Summary for the Trader
By observing these two lines, you can see which direction the market is "leaning." When one line moves significantly while the other remains suppressed, it indicates a high-conviction trend. The goal of this logic is to provide a clearer picture of price continuity, helping you stay with the prevailing momentum rather than getting caught in minor market fluctuations.
/*-----------------------------+
|			       |
| Shared by www.Aptrafx.com    |
|			       |
+------------------------------*/

//+------------------------------------------------------------------+
//|                              Trend continuation factor 2 mt4 .mq4
//|
//|
//|                                  Conversion only Doc Gaines
//|                                  dr_richard_gaines@yahoo.com
//|
//+------------------------------------------------------------------+
#property copyright " Copyright © 2004, MetaQuotes Software Corp."
#property link      " http://www.metaquotes.net/"
#property indicator_separate_window
#property indicator_color1 Blue
#property indicator_buffers 2
#property indicator_color2 Red
#include <stdlib.mqh>
//+------------------------------------------------------------------+
//| Common External variables                                        |
//+------------------------------------------------------------------+
//+------------------------------------------------------------------+
//| External variables                                               |
//+------------------------------------------------------------------+
extern double n = 20;
extern double CountBars = 5000;
extern double t3_period = 5;
extern double b = 0.618;
//+------------------------------------------------------------------+
//| Special Convertion Functions                                     |
//+------------------------------------------------------------------+
int LastTradeTime;
int shift;
double ExtHistoBuffer[];
double ExtHistoBuffer2[];
void SetLoopCount(int loops)
{
}
void SetIndexValue(int shift, double value)
{
  ExtHistoBuffer[shift] = value;
}
void SetIndexValue2(int shift, double value)
{
  ExtHistoBuffer2[shift] = value;
}
//+------------------------------------------------------------------+
//| End                                                              |
//+------------------------------------------------------------------+
//+------------------------------------------------------------------+
//| Initialization                                                   |
//+------------------------------------------------------------------+
int init()
{
   SetIndexStyle(0, DRAW_LINE, STYLE_SOLID);
   SetIndexBuffer(0, ExtHistoBuffer);
   SetIndexStyle(1, DRAW_LINE, STYLE_SOLID);
   SetIndexBuffer(1, ExtHistoBuffer2);
   return(0);
}
int start()
{
//+------------------------------------------------------------------+
//| Local variables                                                  |
//+------------------------------------------------------------------+
//double shift = 0;
int cnt = 0;
double k_n = 0;
double k_p = 0;
int shiftt = 0;
double ch_p = 0;
double ch_n = 0;
double cff_p = 0;
double cff_n = 0;
double AccountedBars = 0;
double CF_p[5001];
double CF_n[5001];
double Change_p[5001];
double Change_n[5001];
double t3 = 0;
double t32 = 0;
double A1 = 0;
double A2 = 0;
double b2 = 0;
double b3 = 0;
double c1 = 0;
double c2 = 0;
double c3 = 0;
double c4 = 0;
double e1 = 0;
double e2 = 0;
double e3 = 0;
double e4 = 0;
double e5 = 0;
double e6 = 0;
double n1 = 0;
double w1 = 0;
double w2 = 0;
double e12 = 0;
double e22 = 0;
double e32 = 0;
double e42 = 0;
double e52 = 0;
double e62 = 0;
/*[[
 Name := Trend Continuation Factor2
 Author := Copyright © 2004, MetaQuotes Software Corp.
 Link := http://www.metaquotes.net/
 Separate Window := Yes
 First Color := Blue
 First Draw Type := Line
 First Symbol := 217
 Use Second Data := Yes
 Second Color := Red
 Second Draw Type := Line
 Second Symbol := 218
]]*/


b2=b*b;
b3=b2*b;
c1=-b3;
c2=(3*(b2+b3));
c3=-3*(2*b2+b+b3);
c4=(1+3*b+b3+3*b2);
n1=t3_period;
if( n1<1 ) n1=1;
n1 = 1 + 0.5*(n1-1);
w1 = 2 / (n1 + 1);
w2 = 1 - w1;
SetLoopCount(0);
// loop from first bar to current bar (with shift=0)
if( AccountedBars == 0 ) AccountedBars = Bars-CountBars;
for(cnt =AccountedBars;cnt <=Bars-1 ;cnt ++){
shift = Bars - 1 - cnt;
{
if( Close[shift] > Close[shift+1])
  { Change_p[shift] = Close[shift]- Close[shift+1];
  CF_p[shift]= Change_p[shift] + CF_p[shift+1];
   Change_n[shift] = 0;
   CF_n[shift]= 0;
   }
     else
  { Change_p[shift] = 0;
   CF_p[shift] = 0;
   Change_n[shift]  = Close[shift+1]- Close[shift];
   CF_n[shift] = Change_n[shift]+ CF_n[shift+1];
   }
}
for(shiftt=shift+n;shiftt>=shift ;shiftt--){
ch_p = Change_p[shiftt] +ch_p;
ch_n = Change_n[shiftt]+ch_n ;
cff_p =  CF_p[shiftt]+cff_p;
cff_n =  CF_n[shiftt]+cff_n;
}
k_p=ch_p-cff_n;
k_n=ch_n-cff_p;
 A1 = k_p;
e1 = w1*A1 + w2*e1;
e2 = w1*e1 + w2*e2;
e3 = w1*e2 + w2*e3;
e4 = w1*e3 + w2*e4;
e5 = w1*e4 + w2*e5;
e6 = w1*e5 + w2*e6;
t3 = c1*e6 + c2*e5 + c3*e4 + c4*e3;
SetIndexValue(shift,t3);
A2 = k_n;
e12 = w1*A2 + w2*e12;
e22 = w1*e12 + w2*e22;
e32 = w1*e22 + w2*e32;
e42 = w1*e32 + w2*e42;
e52 = w1*e42 + w2*e52;
e62 = w1*e52 + w2*e62;
t32 = c1*e62 + c2*e52 + c3*e42 + c4*e32;
SetIndexValue2(shift,t32);
 AccountedBars=AccountedBars+1;
ch_p=0;
ch_n=0;
cff_p=0;
cff_n=0;
}
  return(0);
}

// end//
Comments