TrendContinuation
Download script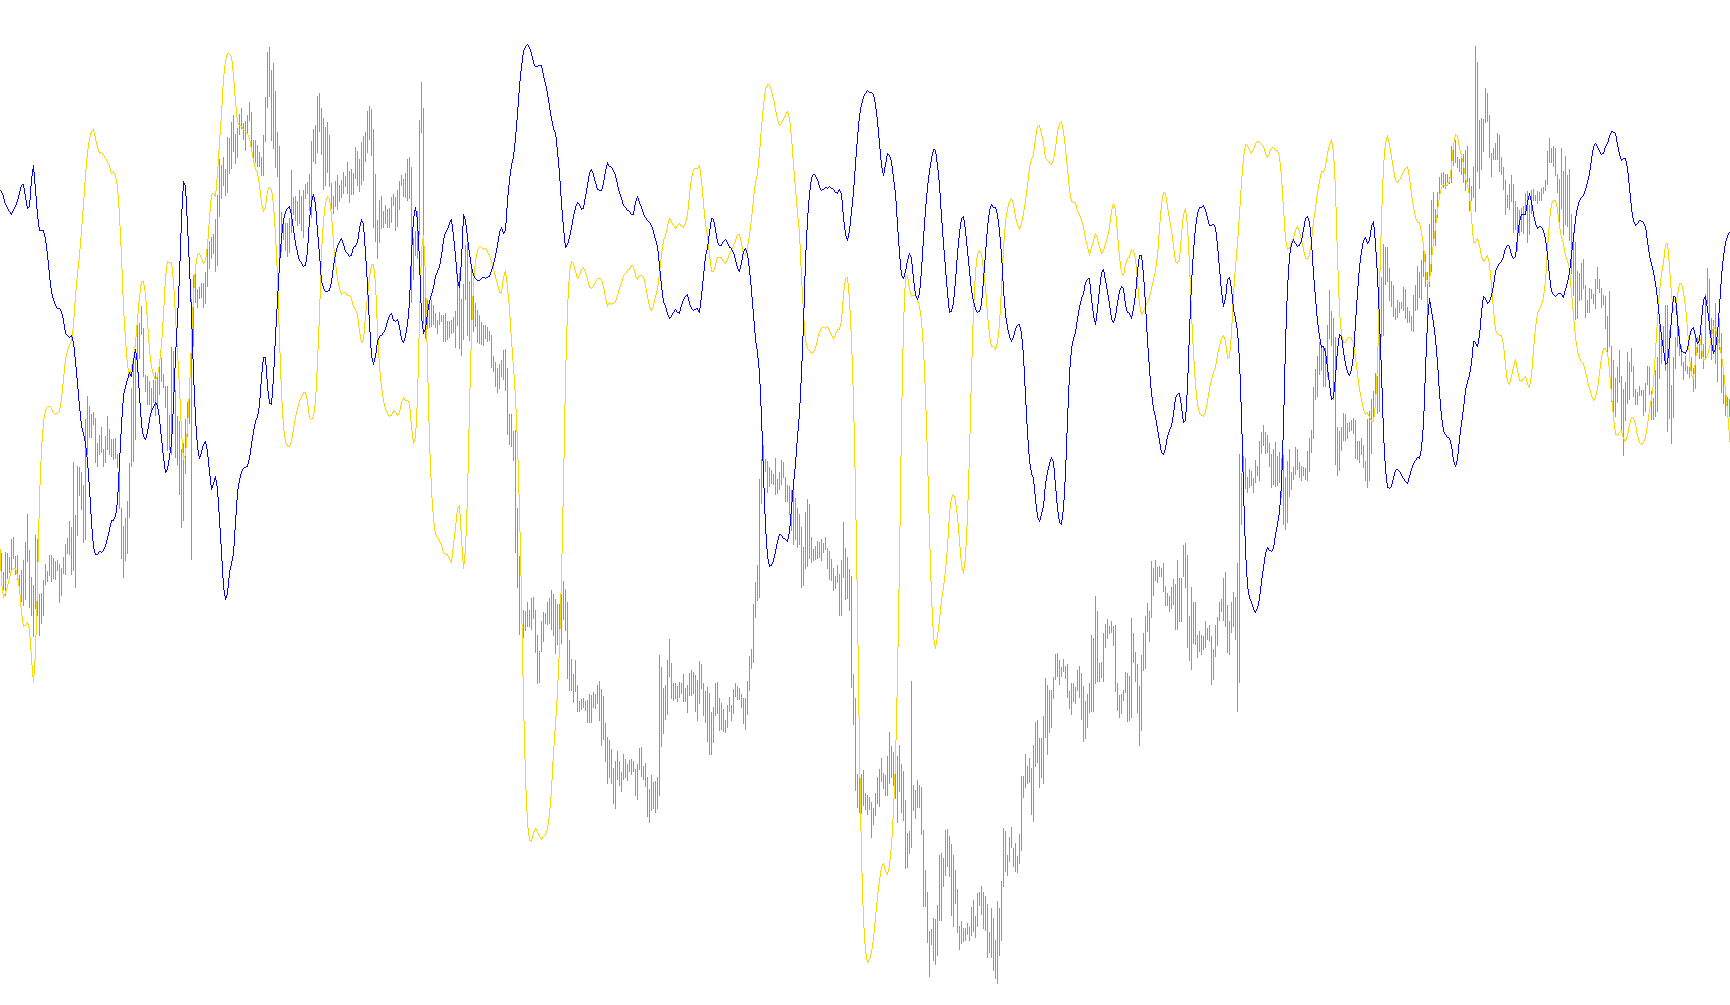
This tool is designed to analyze and visualize market trends by identifying the momentum behind price movements. It operates by calculating a "Trend Continuation Factor," which helps traders distinguish between active trend progression and potential exhaustion or reversals.
Core Logic and Methodology
The script works by breaking down every price candle into two distinct components: upward movement (positive change) and downward movement (negative change). Instead of looking at the raw price, it focuses on the cumulative "strength" of these movements over time.
1. Cumulative Force Tracking The logic first separates price changes into two paths:
- Bullish Path: It tracks how much the price has moved upward and accumulates that strength.
- Bearish Path: It tracks how much the price has moved downward and accumulates that strength. By separating these, the tool can measure the "momentum" of the current trend independently of the opposing direction.
2. Trend Interference Analysis The script then performs a unique calculation where it compares the current movement against the opposite trend's cumulative force. For example, it looks at the current upward momentum and subtracts the accumulated downward force from previous periods. This allows the indicator to reveal whether a trend is genuinely gaining power or if it is being weighed down by previous opposing forces.
3. Smoothing and Weighted Averaging To ensure the data is readable and not erratic (noisy), the script applies a mathematical smoothing process:
- It uses a Weighted Moving Average approach, which gives more importance to recent price actions while still considering historical context.
- This creates a fluid line rather than jumpy data points, making it easier for a human observer to see the "flow" of the market.
4. The T3 Smoothing Calculation The script utilizes a specific mathematical formula known as "T3." This is an advanced smoothing technique that balances two competing goals: reducing market noise (the "jitter" in price) while maintaining the integrity of the trend (ensuring the indicator doesn't lag too far behind current prices).
Visual Representation
The tool outputs two distinct lines on a separate window:
- Blue Line: Represents the Trend Continuation Factor for upward momentum.
- Red Line: Represents the Trend Continuation Factor for downward momentum.
By observing these lines, users can see which direction currently holds the most "weight." When one line is significantly higher or shows a steeper incline while the other stays flat or declines, it suggests a strong continuation of that specific trend. Conversely, when the lines begin to flatten or cross, it may signal that the current momentum is losing steam.
//+------------------------------------------------------------------+
//|                              Trend continuation factor 2 mt4 .mq4
//|
//|
//|                                  Conversion only Doc Gaines
//|                                  dr_richard_gaines@yahoo.com
//|
//+------------------------------------------------------------------+
#property copyright " Copyright © 2004, MetaQuotes Software Corp."
#property link      " http://www.metaquotes.net/"
#property indicator_separate_window
#property indicator_color1 Blue
#property indicator_buffers 2
#property indicator_color2 Red
#include <stdlib.mqh>
//+------------------------------------------------------------------+
//| Common External variables                                        |
//+------------------------------------------------------------------+
//+------------------------------------------------------------------+
//| External variables                                               |
//+------------------------------------------------------------------+
extern double n = 20;
extern double CountBars = 5000;
extern double t3_period = 5;
extern double b = 0.618;
//+------------------------------------------------------------------+
//| Special Convertion Functions                                     |
//+------------------------------------------------------------------+
int LastTradeTime;
int shift;
double ExtHistoBuffer[];
double ExtHistoBuffer2[];
void SetLoopCount(int loops)
{
}
void SetIndexValue(int shift, double value)
{
  ExtHistoBuffer[shift] = value;
}
void SetIndexValue2(int shift, double value)
{
  ExtHistoBuffer2[shift] = value;
}
//+------------------------------------------------------------------+
//| End                                                              |
//+------------------------------------------------------------------+
//+------------------------------------------------------------------+
//| Initialization                                                   |
//+------------------------------------------------------------------+
int init()
{
   SetIndexStyle(0, DRAW_LINE, STYLE_SOLID);
   SetIndexBuffer(0, ExtHistoBuffer);
   SetIndexStyle(1, DRAW_LINE, STYLE_SOLID);
   SetIndexBuffer(1, ExtHistoBuffer2);
   return(0);
}
int start()
{
//+------------------------------------------------------------------+
//| Local variables                                                  |
//+------------------------------------------------------------------+
//double shift = 0;
int cnt = 0;
double k_n = 0;
double k_p = 0;
int shiftt = 0;
double ch_p = 0;
double ch_n = 0;
double cff_p = 0;
double cff_n = 0;
double AccountedBars = 0;
double CF_p[5001];
double CF_n[5001];
double Change_p[5001];
double Change_n[5001];
double t3 = 0;
double t32 = 0;
double A1 = 0;
double A2 = 0;
double b2 = 0;
double b3 = 0;
double c1 = 0;
double c2 = 0;
double c3 = 0;
double c4 = 0;
double e1 = 0;
double e2 = 0;
double e3 = 0;
double e4 = 0;
double e5 = 0;
double e6 = 0;
double n1 = 0;
double w1 = 0;
double w2 = 0;
double e12 = 0;
double e22 = 0;
double e32 = 0;
double e42 = 0;
double e52 = 0;
double e62 = 0;
/*[[
 Name := Trend Continuation Factor2
 Author := Copyright © 2004, MetaQuotes Software Corp.
 Link := http://www.metaquotes.net/
 Separate Window := Yes
 First Color := Blue
 First Draw Type := Line
 First Symbol := 217
 Use Second Data := Yes
 Second Color := Red
 Second Draw Type := Line
 Second Symbol := 218
]]*/


b2=b*b;
b3=b2*b;
c1=-b3;
c2=(3*(b2+b3));
c3=-3*(2*b2+b+b3);
c4=(1+3*b+b3+3*b2);
n1=t3_period;
if( n1<1 ) n1=1;
n1 = 1 + 0.5*(n1-1);
w1 = 2 / (n1 + 1);
w2 = 1 - w1;
SetLoopCount(0);
// loop from first bar to current bar (with shift=0)
if( AccountedBars == 0 ) AccountedBars = Bars-CountBars;
for(cnt =AccountedBars;cnt <=Bars-1 ;cnt ++){
shift = Bars - 1 - cnt;
{
if( Close[shift] > Close[shift+1])
  { Change_p[shift] = Close[shift]- Close[shift+1];
  CF_p[shift]= Change_p[shift] + CF_p[shift+1];
   Change_n[shift] = 0;
   CF_n[shift]= 0;
   }
     else
  { Change_p[shift] = 0;
   CF_p[shift] = 0;
   Change_n[shift]  = Close[shift+1]- Close[shift];
   CF_n[shift] = Change_n[shift]+ CF_n[shift+1];
   }
}
for(shiftt=shift+n;shiftt>=shift ;shiftt--){
ch_p = Change_p[shiftt] +ch_p;
ch_n = Change_n[shiftt]+ch_n ;
cff_p =  CF_p[shiftt]+cff_p;
cff_n =  CF_n[shiftt]+cff_n;
}
k_p=ch_p-cff_n;
k_n=ch_n-cff_p;
 A1 = k_p;
e1 = w1*A1 + w2*e1;
e2 = w1*e1 + w2*e2;
e3 = w1*e2 + w2*e3;
e4 = w1*e3 + w2*e4;
e5 = w1*e4 + w2*e5;
e6 = w1*e5 + w2*e6;
t3 = c1*e6 + c2*e5 + c3*e4 + c4*e3;
SetIndexValue(shift,t3);
A2 = k_n;
e12 = w1*A2 + w2*e12;
e22 = w1*e12 + w2*e22;
e32 = w1*e22 + w2*e32;
e42 = w1*e32 + w2*e42;
e52 = w1*e42 + w2*e52;
e62 = w1*e52 + w2*e62;
t32 = c1*e62 + c2*e52 + c3*e42 + c4*e32;
SetIndexValue2(shift,t32);
 AccountedBars=AccountedBars+1;
ch_p=0;
ch_n=0;
cff_p=0;
cff_n=0;
}
  return(0);
}

// end//
Comments