Trend_Manager
Download script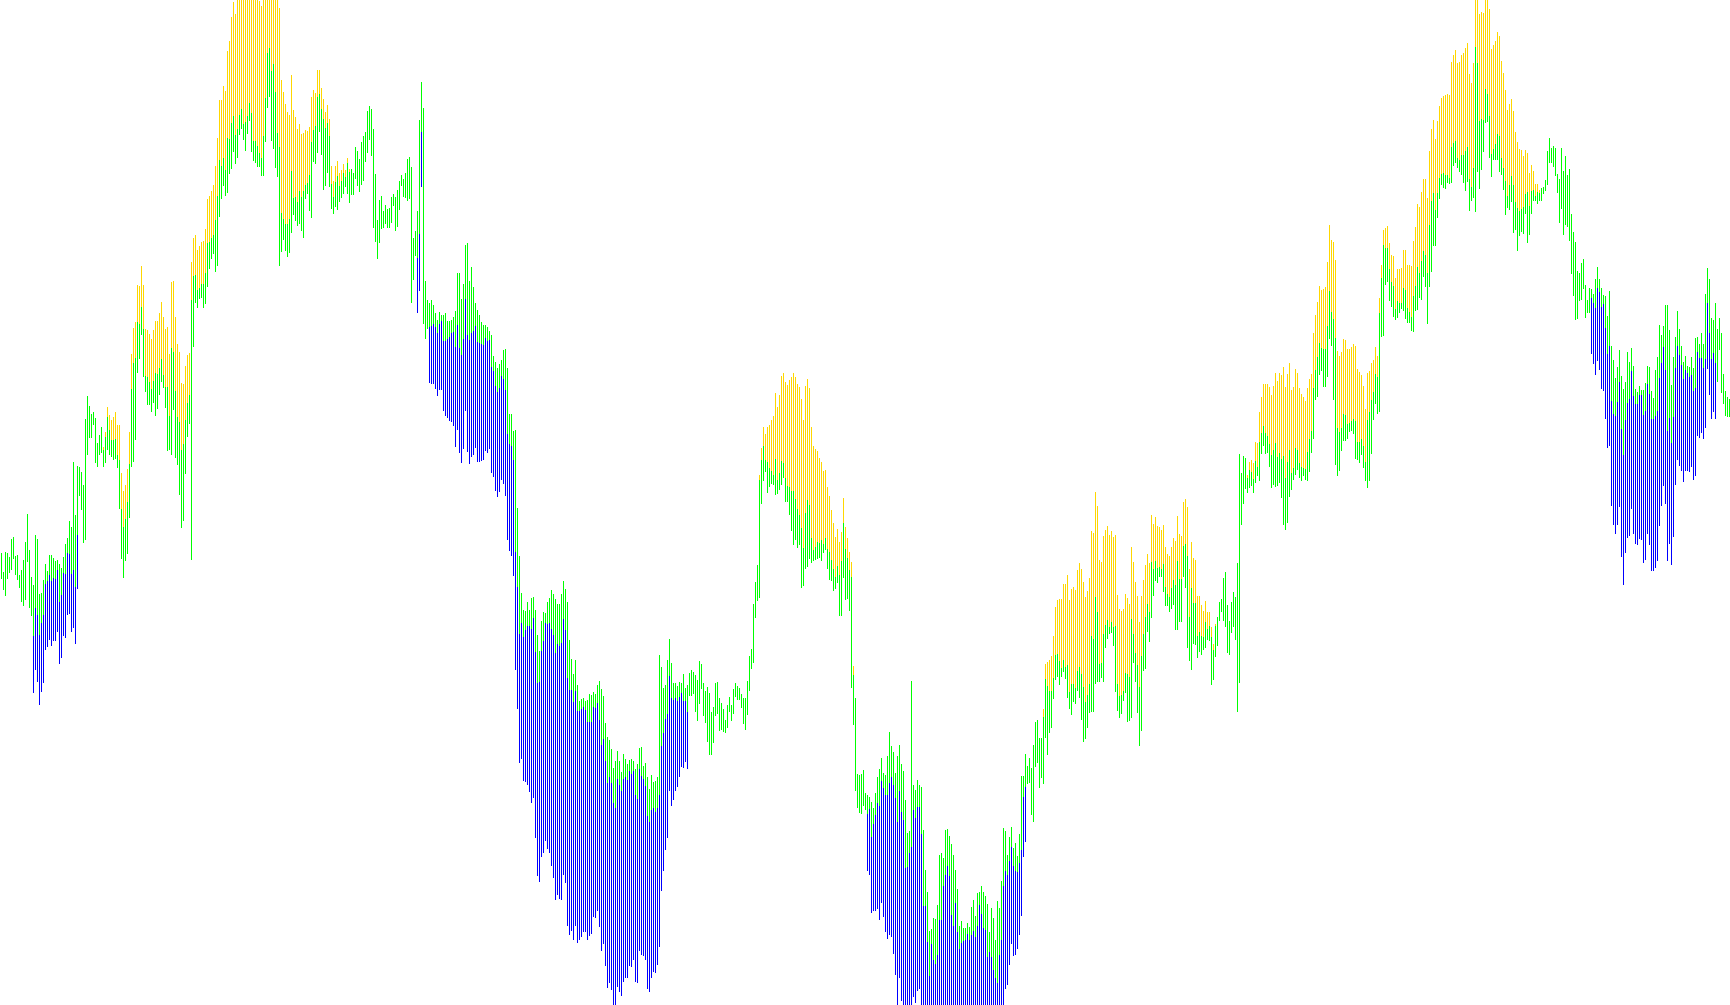
The Trend Manager is a visual trading tool designed to help market participants identify the prevailing direction of price movement and highlight areas where the trend shows significant strength or potential exhaustion. Rather than simply plotting a moving average line, this script creates a dynamic visual "histogram" on your chart that reacts to the relationship between two different price averages.
How the Logic Works
The core functionality of the tool relies on comparing a Fast Moving Average (which tracks recent price action) against a Slow Moving Average (which tracks long-term trends). By calculating the distance between these two averages, the script determines the "momentum" of the market.
1. The Threshold Filter (DVLimit) The tool does not react to every minor fluctuation in the market. It uses a specific limit (the Divergence Limit) to act as a filter. Only when the gap between the fast and slow averages becomes large enough to exceed this threshold will the tool trigger a visual signal on the chart. This helps filter out "market noise" and ensures that only significant trend movements are highlighted.
2. Visual Trend Identification The script categorizes market behavior into two primary actions based on the direction of that gap:
- Bullish Strength (Upward Trend): When the fast average rises significantly above the slow average beyond the established limit, the tool identifies a positive trend. It marks this on the chart by drawing from the high prices of the candles, visually extending the data upward.
- Bearish Strength (Downward Trend): Conversely, when the fast average drops significantly below the slow average, the tool identifies a negative trend. In this case, it marks the data from the low prices of the candles, extending the visual indicator downward.
Summary for the User
Essentially, this script acts as a momentum filter. It looks at the "stretch" between short-term and long-term price behavior. When that stretch becomes wide enough to be significant, the tool paints a histogram on your chart.
- Higher signals indicate the market is pushing strongly in an upward direction.
- Lower signals indicate the market is pushing strongly in a downward direction.
By observing these visual markers, traders can more easily identify when a trend has gained enough momentum to be significant, providing a clearer picture of market sentiment than looking at price action alone.
//+------------------------------------------------------------------+
//|                                                Trend Manager.mq4 |
//|                             Copyright © 2006,  Alejandro Galindo |
//|                                              http://elCactus.com |
//+------------------------------------------------------------------+
// Based on indicator sold at traderstradingsystem.com

#property indicator_chart_window
#property indicator_buffers 2
#property indicator_color1 Blue
#property indicator_color2 Red

// Divergence controls
extern double DVLimit=0.0007;
extern int    Fast_Period=23;
extern int    Fast_Price = PRICE_OPEN;
extern int    Slow_Period=84;
extern int    Slow_Price = PRICE_OPEN;
extern int    BarCount=1500;

double SpanA_Buffer[];
double SpanB_Buffer[];

int tickcount=0;

int init()
{
   // histogram defined by top and bottom buffer
   // pos or neg from top buffer determines color

   SetIndexStyle(0,DRAW_HISTOGRAM,STYLE_SOLID);
   SetIndexBuffer(0,SpanB_Buffer);
   //SetIndexDrawBegin(0,TM_Period+TM_Shift-1);
   //SetIndexLabel(0,"TM_Period+");

   SetIndexStyle(1,DRAW_HISTOGRAM,STYLE_SOLID);
   SetIndexBuffer(1,SpanA_Buffer);
   //SetIndexDrawBegin(1,TM_Period+TM_Shift-1);
   //SetIndexLabel(1,"TM_Period");
}

int start()
{
   int    pos;

   int iFileHandle;

   double maF1, maF2, maS1, maS2;
   double D;

   for(pos=BarCount; pos>=0; pos--)
     {
      // Create Divergence stage one
      maF1=iMA(Symbol(),0,Fast_Period,0,MODE_SMA,Fast_Price,pos);
      maS1=iMA(Symbol(),0,Slow_Period,0,MODE_SMA,Slow_Price,pos);
      D=maF1-maS1;

      SpanA_Buffer[pos]  = 0;
      SpanB_Buffer[pos]  = 0;

      if( D >= DVLimit )
        {
         SpanA_Buffer[pos]  = High[pos];
         SpanB_Buffer[pos]  = High[pos]+(D-DVLimit);
        }

      if( D <= (DVLimit*(-1)) )
        {
         SpanA_Buffer[pos]  = Low[pos];
         SpanB_Buffer[pos]  = Low[pos]+(D-DVLimit);
        }
     } //for

  } //start
Comments