[i]test_histo2_v1
Download script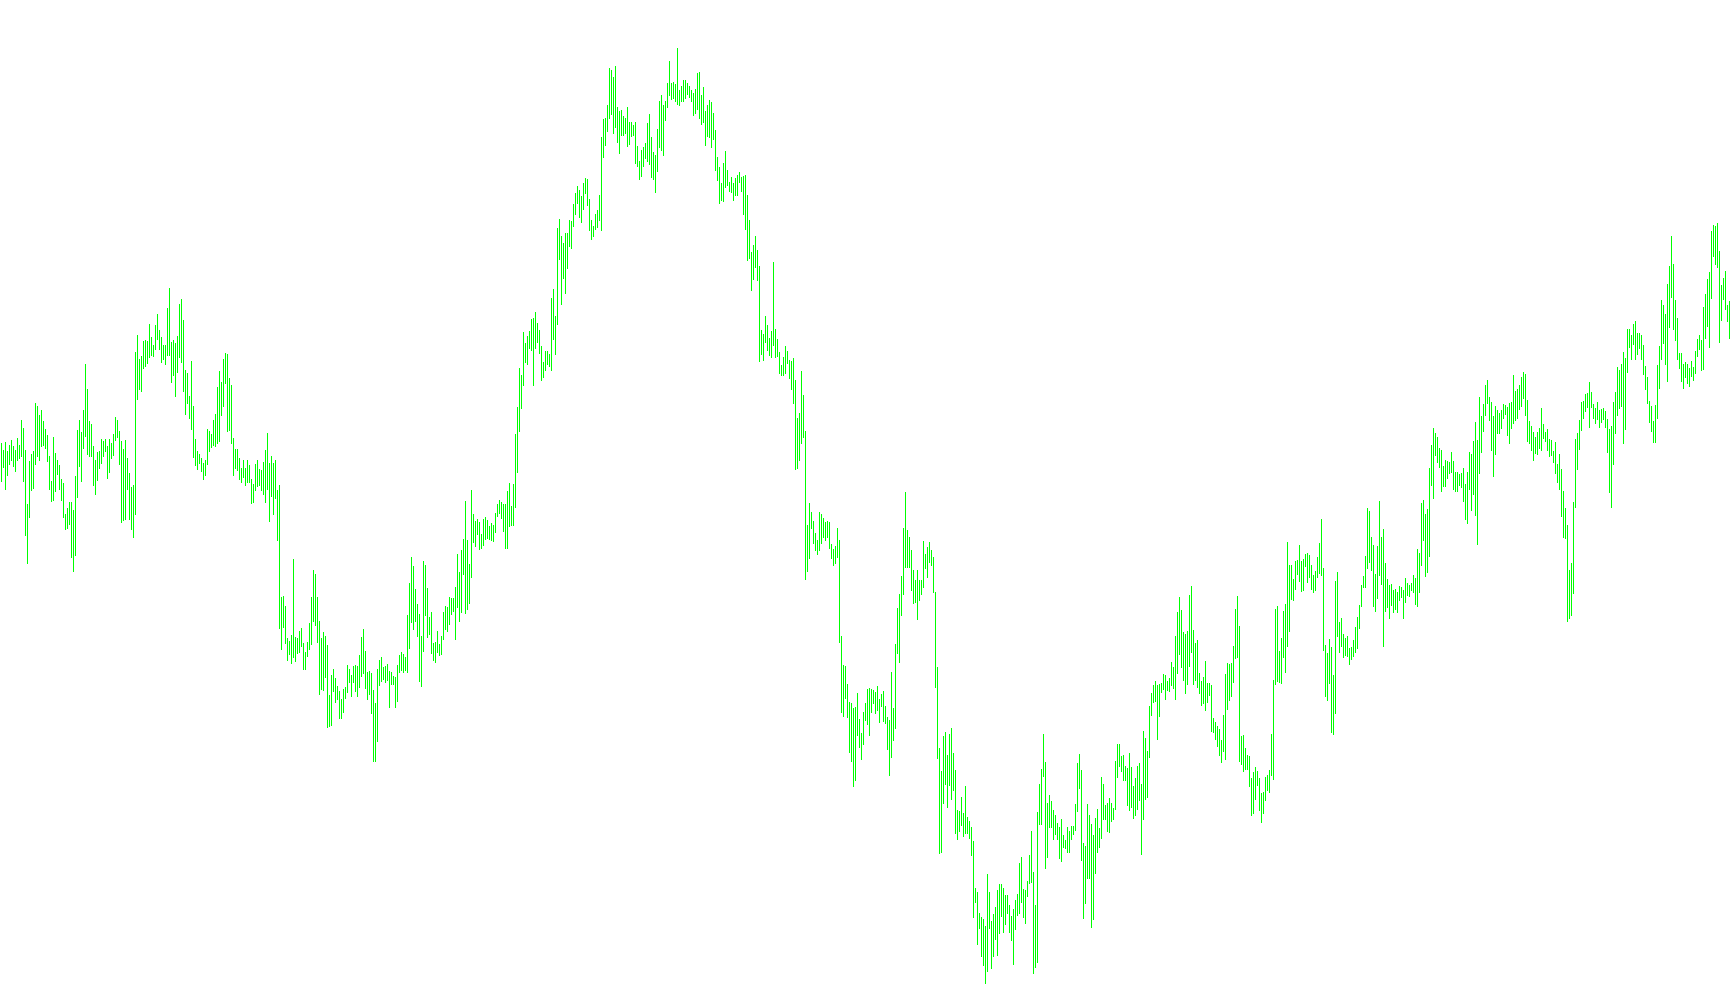
Trend Analysis Logic Overview
The Trend Manager is a visual charting tool designed to help traders identify significant shifts in market momentum and trend direction. Rather than simply following the raw price action, this script analyzes the relationship between two different moving averages—one that reacts quickly to price changes and another that tracks the broader, long-term trend.
How the Logic Works
The core functionality of the script relies on calculating the "distance" or divergence between a fast-moving average and a slow-moving average. Here is the step-by-step logic:
- Trend Identification: The system continuously calculates two separate averages based on customizable periods (Fast and Slow). By subtracting the slow average from the fast average, the script determines the "gap" or strength of the current trend.
- Threshold Filtering: To ensure that only significant market movements are highlighted—while ignoring minor market noise—the script uses a specific limit (Divergence Limit). Only when the difference between the two averages exceeds this set threshold does the tool trigger a visual signal.
- Visual Signaling: When the trend strength crosses the required threshold, the script generates a histogram on your chart:
- Upward Momentum: If the fast average is significantly higher than the slow average, it identifies a potential bullish trend and marks the price area accordingly.
- Downward Momentum: If the fast average falls significantly below the slow average, it identifies a potential bearish trend and marks that area on the chart.
- Dynamic Scaling: The height of the visual histogram is dynamically scaled based on the intensity of the divergence. This means that a stronger trend will be represented by a more pronounced visual marker on the chart, allowing you to see at a glance which trends are the most powerful.
Summary for Traders
This tool acts as a momentum filter. It helps you visualize where the market is showing strong directional conviction. By highlighting only those moments where the price movement deviates significantly from the long-term average, it assists in identifying clear trend zones while helping to filter out insignificant price fluctuations.
/*-----------------------------+
|			       |
| Shared by www.Aptrafx.com    |
|			       |
+------------------------------*/

// Trend Manager.mq4
// Based on indicator sold at traderstradingsystem.com

#property indicator_chart_window
#property indicator_buffers 2
#property indicator_color1 Blue
#property indicator_color2 Red

// Divergence controls
extern double DVLimit=0.0007;
extern int    Fast_Period=23;
extern int    Fast_Price = PRICE_OPEN;
extern int    Slow_Period=84;
extern int    Slow_Price = PRICE_OPEN;
extern int    BarCount=1500;

double SpanA_Buffer[];
double SpanB_Buffer[];

int tickcount=0;

int init()
{
   // histogram defined by top and bottom buffer
   // pos or neg from top buffer determines color

   SetIndexStyle(0,DRAW_HISTOGRAM,STYLE_SOLID);
   SetIndexBuffer(0,SpanB_Buffer);
   //SetIndexDrawBegin(0,TM_Period+TM_Shift-1);
   //SetIndexLabel(0,"TM_Period+");

   SetIndexStyle(1,DRAW_HISTOGRAM,STYLE_SOLID);
   SetIndexBuffer(1,SpanA_Buffer);
   //SetIndexDrawBegin(1,TM_Period+TM_Shift-1);
   //SetIndexLabel(1,"TM_Period");
}

int start()
{
   int    pos;

   int iFileHandle;

   double maF1, maF2, maS1, maS2;
   double D;

   for(pos=BarCount; pos>=0; pos--)
     {
      // Create Divergence stage one
      maF1=iMA(Symbol(),0,Fast_Period,0,MODE_SMA,Fast_Price,pos);
      maS1=iMA(Symbol(),0,Slow_Period,0,MODE_SMA,Slow_Price,pos);
      D=maF1-maS1;

      if( D >= DVLimit )
        {
         SpanA_Buffer[pos]  = High[pos];
         SpanB_Buffer[pos]  = High[pos]+(D-DVLimit);
        }

      if( D <= (DVLimit*(-1)) )
        {
         SpanA_Buffer[pos]  = Low[pos];
         SpanB_Buffer[pos]  = Low[pos]+(D-DVLimit);
        }

     } //for

  } //start
Comments