TRD2
Download script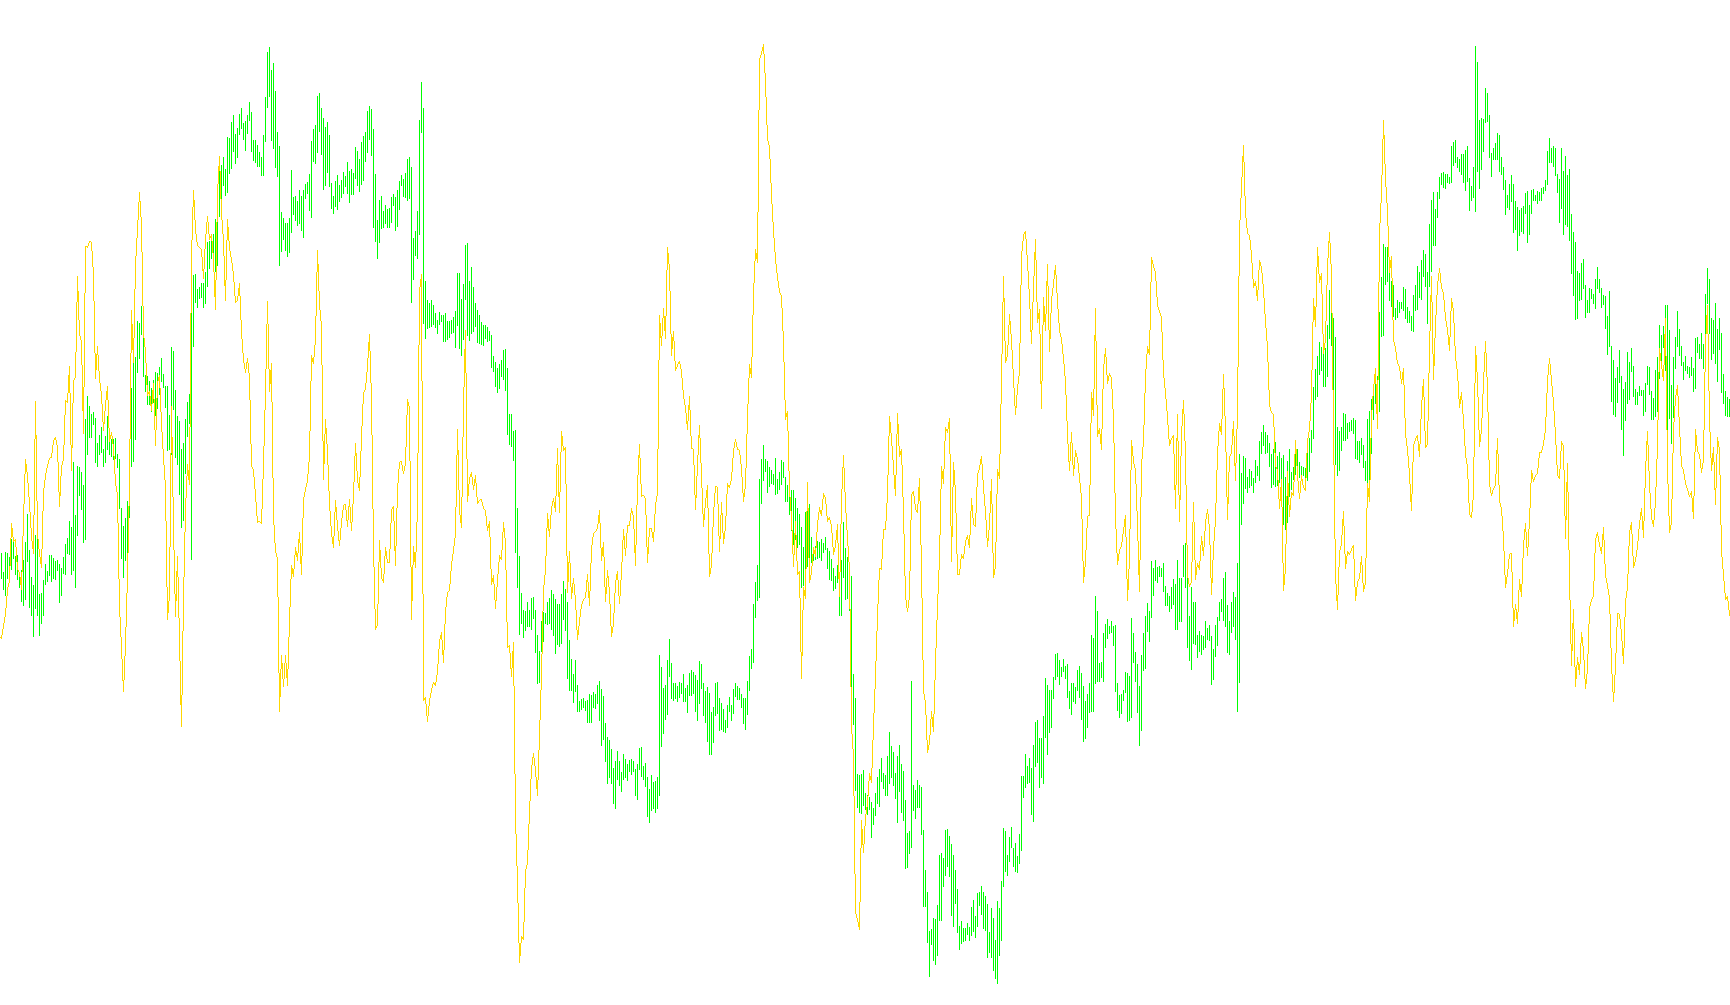
This script is a custom technical analysis tool designed to measure how significantly the current market price is deviating from its historical average. Instead of looking at price in isolation, it evaluates the relationship between the "now" and the "recent past" to help traders visualize momentum and potential overextended movements.
Core Logic Overview
The tool operates by calculating a Moving Average (MA) based on a specific timeframe that you choose. Once this average is established, the script performs a simple division: it takes the current closing price of the asset and divides it by the value of the Moving Average.
The resulting figure represents a Trend Deviation. Here is how to interpret that logic:
- Baseline Value: When the market price is perfectly aligned with its moving average, the indicator will sit at a value of 1.0.
- Above the Baseline: If the resulting value is higher than 1.0, it indicates that the current price is trading above its average (bullish momentum). The further away from 1.0 the line moves upward, the more "stretched" or overbought the price may be relative to its recent history.
- Below the Baseline: If the resulting value is lower than 1.0, it indicates that the current price is trading below its average (bearish momentum). The further down it moves, the stronger the downward pressure relative to the average.
Customizable Flexibility
The script is designed to be adaptable to different trading styles through three primary settings:
- Period: You can define how many previous bars the tool should look at to calculate the average. A longer period smooths out the data for long-term trends, while a shorter period makes the tool more sensitive to rapid price swings.
- Moving Average Type: The script allows you to choose different mathematical methods for calculating the average (such as Simple, Exponential, Smoothed, or Linear Weighted). Each method reacts differently to new price data, allowing you to choose one that best fits your specific strategy.
- Visual Feedback: The indicator appears in a separate window beneath your main chart, providing a clear, dedicated space to monitor these deviations without cluttering the price action.
By focusing on the ratio between price and average rather than just the price itself, this tool helps identify whether a move is healthy or potentially over-extended.
//+------------------------------------------------------------------+
//|                                                          TRD.mq4 |
//|                                                          by Raff |
//|                                                                  |
//+------------------------------------------------------------------+
#property copyright "Copyright © 2006, raff1410@o2.pl"

#property indicator_separate_window
#property indicator_buffers 1
#property indicator_color1 Aqua
#property indicator_level1 1
//---- indicator parameters
extern int MA_Period=20;
extern int MA_Method=0;
//---- indicator buffers
double ExtMapBuffer[];
//----
int ExtCountedBars=0;
//+------------------------------------------------------------------+
//| Custom indicator initialization function                         |
//+------------------------------------------------------------------+
int init()
  {
   int    draw_begin;
   string short_name;
//---- drawing settings
   SetIndexStyle(0,DRAW_LINE);
// SetIndexShift(0,MA_Shift);
   IndicatorDigits(MarketInfo(Symbol(),MODE_DIGITS));
   if(MA_Period<2) MA_Period=13;
   draw_begin=MA_Period-1;
//---- indicator short name
   switch(MA_Method)
     {
      case 1 : short_name="Trend deviation | EMA(";  draw_begin=0; break;
      case 2 : short_name="Trend deviation | SMMA("; break;
      case 3 : short_name="Trend deviation | LWMA("; break;
      default :
         MA_Method=0;
         short_name="Trend deviation | SMA(";
     }
   IndicatorShortName(short_name+MA_Period+")");
   SetIndexDrawBegin(0,draw_begin);
//---- indicator buffers mapping
   SetIndexBuffer(0,ExtMapBuffer);
//---- initialization done
   return(0);
  }
//+------------------------------------------------------------------+
//| TRD - Trend Deviation                                            |
//+------------------------------------------------------------------+
int start()
  {
   if(Bars<=MA_Period) return(0);
   ExtCountedBars=IndicatorCounted();
//---- check for possible errors
   if (ExtCountedBars<0) return(-1);
//---- last counted bar will be recounted
   if (ExtCountedBars>0) ExtCountedBars--;
//----
   int i,pos=Bars-ExtCountedBars-1;
//---- initial accumulation
   if(pos<MA_Period) pos=MA_Period;
//---- main calculation loop
   while(pos>=0)
     {
      double ma=iMA(NULL,0,MA_Period,0,MA_Method,0,pos);
      if (ma!=0)
      ExtMapBuffer[pos]=Close[pos]/ma;
 	   pos--;
     }
//---- done
   return(0);
  }
Comments