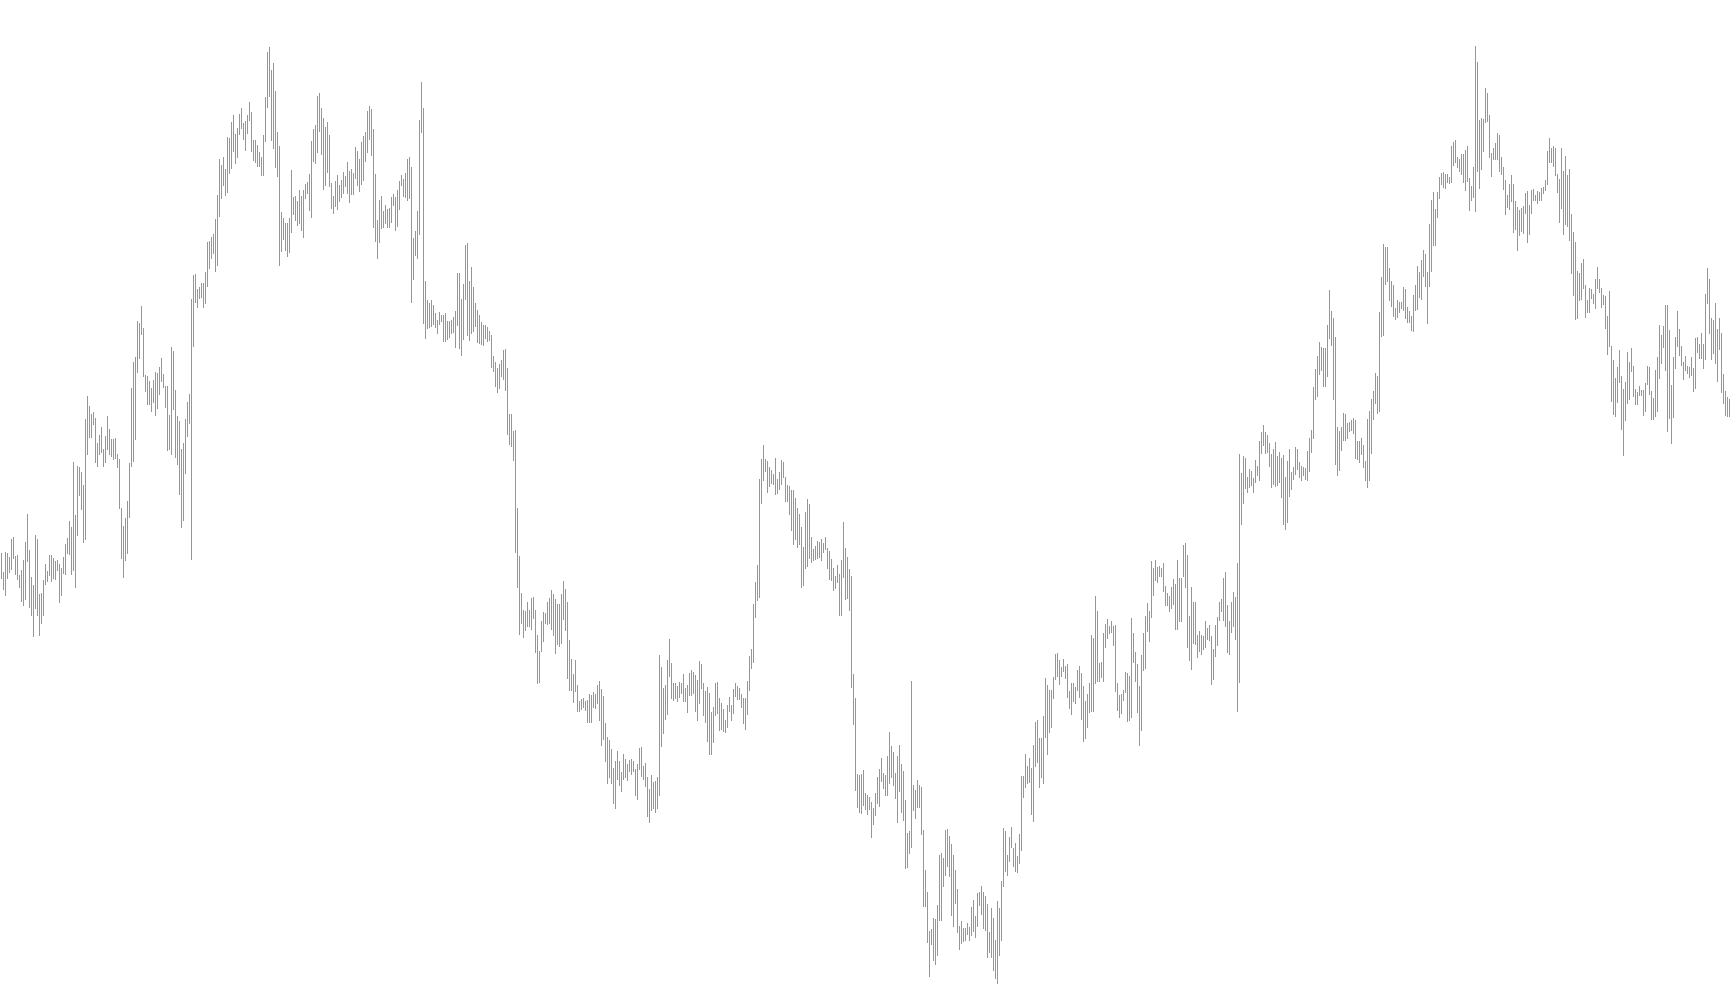
This script implements a sophisticated technical analysis tool known as the T3 Moving Average. Unlike standard moving averages that can often be sluggish or fail to react quickly enough to sudden market shifts, the T3 is designed to provide a much smoother line while maintaining high responsiveness to price action.
How the Logic Works
The core philosophy behind this script is "data fitting." It aims to reduce the "noise" of the market—those small, insignificant price fluctuations—without sacrificing the accuracy of the overall trend. It achieves this through a multi-layered processing technique:
1. Layered Smoothing (The Foundation) Instead of calculating an average once, the script performs a recursive process. It takes the closing prices and calculates an Exponential Moving Average (EMA). It then takes that result and calculates another EMA from it, repeating this sequence multiple times. By nesting these averages within one another, the script creates a highly stabilized data set where extreme outliers are filtered out.
2. Weighted Calculation (The Refinement) Once the layers of smoothing are established, the script applies a specific mathematical formula to combine them. It uses a "coefficient" system (based on an amplification factor). This allows the tool to weigh different smoothed layers differently, ensuring that the final line stays as close to the actual price movement as possible while remaining visually smooth.
3. Visual Output The final result is a single, fluid line displayed on your chart (colored Aqua by default). This line serves as a high-fidelity trend tracker:
- When the line is steady and moving in a specific direction, it confirms the prevailing trend.
- Because of its unique logic, it is less likely to "wobble" than traditional averages, making it easier for traders to identify sustained momentum without being distracted by minor market hiccups.
Summary for the User
In simple terms, this script takes raw, jagged price data and puts it through a sophisticated "filter." It smooths out the jittery movements of the market by layering several averages on top of each other and then blending them using a specialized formula. This provides you with a cleaner, more reliable view of the trend than standard moving average tools.
//+------------------------------------------------------------------+
//|                                                         T3MA.mq4 |
//|                                     Copyright © 2005, Nick Bilak |
//|                                        http://www.forex-tsd.com/ |
//+------------------------------------------------------------------+
#property copyright "Copyright © 2005, Nick Bilak"
#property link      "http://www.forex-tsd.com/"

//---- indicator settings
#property  indicator_chart_window
#property  indicator_buffers 1
#property  indicator_color1  Aqua

/*
Overview
T3 is an excellent data-fitting technique by Tim Tillson (cf. ``Smoothing Techniques For More Accurate Signals'' in Technical Analysis of Stocks and Commodities - January 1998)

Calculation
N is the Exponential Moving Average Period a is the amplification percentage of the filter's response to price movement (0 < a < 1)

e1 = N-days EMA of Close Prices
e2 = N-days EMA of e1
e3 = N-days EMA of e2
e4 = N-days EMA of e3
e5 = N-days EMA of e4
e6 = N-days EMA of e5

c1 = (-a)^3
c2 = 3 * a^2
c3 = - 6 * a^2 - 3 * a - 3 * a^3
c4 = 1 + 3 * a + a^3 + 3 * a^2

T3 = c1 * e6 + c2 * e5 + c3 * e4 + c4 * e3

Parameters
The default values are : N = 5 a = 0.7

Examples
GT::Indicators::T3->new() GT::Indicators::T3->new([5, 0.7])

*/

//---- indicator parameters
extern int Periods=12;
//---- indicator buffers
double e1[];
double e2[];
double e3[];
double e4[];
double e5[];
double e6[];
double e7[];
//+------------------------------------------------------------------+
//| Custom indicator initialization function                         |
//+------------------------------------------------------------------+
int init()
  {
   IndicatorBuffers(7);
//---- drawing settings
   SetIndexStyle(0,DRAW_LINE);
   SetIndexDrawBegin(0,Periods);
   if(
   	!SetIndexBuffer(0,e7) &&
      !SetIndexBuffer(1,e2) &&
      !SetIndexBuffer(2,e3) &&
      !SetIndexBuffer(3,e4) &&
      !SetIndexBuffer(4,e5) &&
      !SetIndexBuffer(5,e6) &&
   	!SetIndexBuffer(6,e1)
      )
      Print("cannot set indicator buffers!");
//---- name for DataWindow and indicator subwindow label
   IndicatorShortName("T3MA("+Periods+")");
//---- initialization done
   return(0);

  }
//+------------------------------------------------------------------+
//| Moving Average of Oscillator                                     |
//+------------------------------------------------------------------+
int start()
  {
   int i,limit;
   int counted_bars=IndicatorCounted();
//---- check for possible errors
   if(counted_bars<0) return(-1);
//---- last counted bar will be recounted
   if(counted_bars>0) counted_bars--;
   limit=Bars-Periods-1-counted_bars;

//---- main loop
   for(i=limit; i>=0; i--) {
   	e1[i]=iMA(NULL,0,Periods,0,MODE_EMA,PRICE_CLOSE,i);
   }
   for(i=limit; i>=0; i--) {
   	e2[i]=iMAOnArray(e1,0,Periods,0,MODE_EMA,i);
   }
   for(i=limit; i>=0; i--) {
   	e3[i]=iMAOnArray(e2,0,Periods,0,MODE_EMA,i);
   }
   for(i=limit; i>=0; i--) {
   	e4[i]=iMAOnArray(e3,0,Periods,0,MODE_EMA,i);
   }
   for(i=limit; i>=0; i--) {
   	e5[i]=iMAOnArray(e4,0,Periods,0,MODE_EMA,i);
   }
	double a=0.8;
	double c1=-a*a*a;
	double c2=3*a*a+3*a*a*a;
	double c3=-6*a*a-3*a-3*a*a*a;
	double c4=1+3*a+a*a*a+3*a*a;
	//T3MA=c1*e6+c2*e5+c3*e4+c4*e3;
   for(i=limit; i>=0; i--) {
   	e6[i]=iMAOnArray(e5,0,Periods,0,MODE_EMA,i);
   	e7[i]=c1*e6[i]+c2*e5[i]+c3*e4[i]+c4*e3[i];
   }
//---- done
   return(0);
  }
//+------------------------------------------------------------------+
Comments