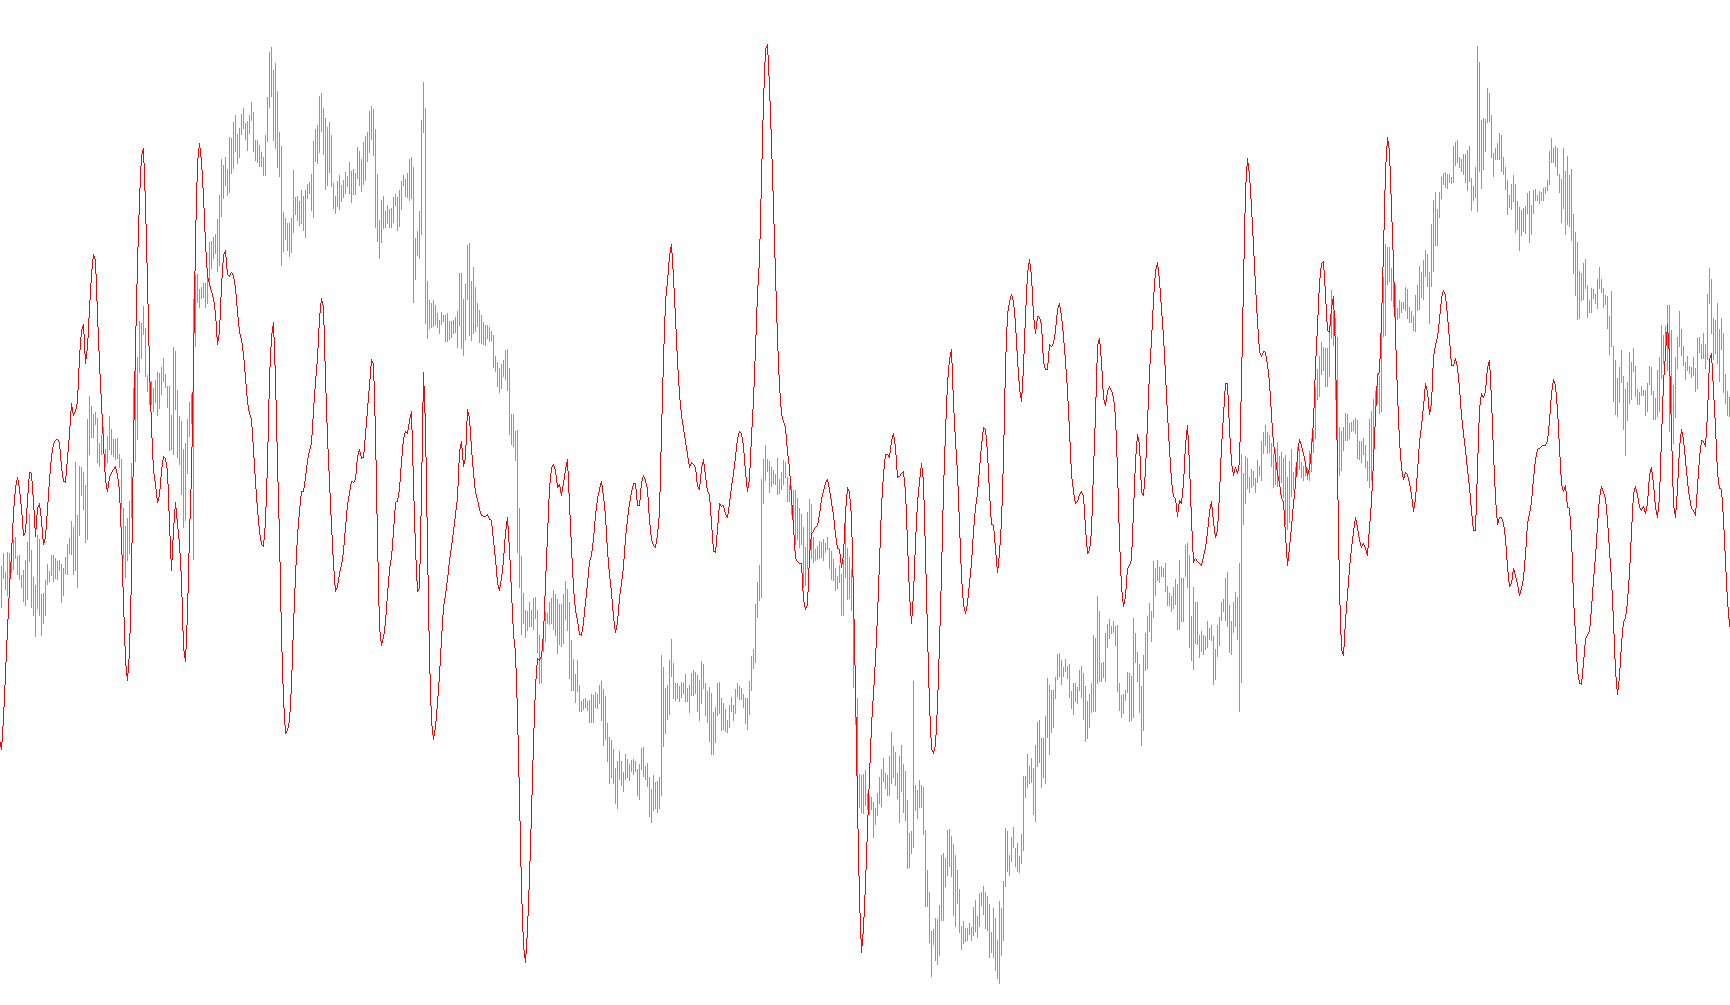
This tool is a specialized technical analysis indicator designed to provide traders with a smoother, more refined view of market momentum by utilizing a sophisticated mathematical smoothing technique. Unlike standard moving averages that can sometimes react too quickly to "noise" (minor price fluctuations) or too slowly to significant trends, this script employs a multi-layered calculation to produce a more reliable visual signal.
Core Logic and Methodology
The underlying logic functions through three distinct phases:
1. Differential Analysis The script begins by looking at the relationship between two different types of exponential moving averages (EMAs). Specifically, it tracks the difference between a fast-reacting average based on closing prices and a slightly slower average based on opening prices. By focusing on this difference rather than just the price itself, the tool identifies the underlying "velocity" or strength of the current price movement.
2. Recursive Smoothing (The Triple EMA Chain) Once the initial difference is calculated, the script passes that data through a sequence of six consecutive smoothing stages. Each stage takes the result of the previous one and blends it with new data using a weighted calculation. This "daisy-chain" approach ensures that the resulting line is significantly less jagged than standard indicators. It effectively filters out market "jitter," leaving behind a clear representation of the prevailing trend.
3. Weighted Polynomial Calculation In the final step, the tool applies a specific set of mathematical coefficients (derived from user-defined inputs). These coefficients act as a balancing mechanism, weighting the various stages of the smoothed data to produce the final output. This ensures that the indicator maintains a high level of accuracy relative to the period selected by the user, providing a "refined" trend line that helps traders see the true direction of the market.
Summary for Traders
In practical terms, this script acts as a high-precision trend filter. By combining differential analysis with deep recursive smoothing, it offers a visual representation of market momentum that is designed to be more stable than basic moving averages. It aims to help users distinguish between temporary price noise and sustained directional movements, making it a tool for identifying the core "flow" of the market.
/*-----------------------------+
|			       |
| Shared by www.Aptrafx.com    |
|			       |
+------------------------------*/

//+------------------------------------------------------------------+
//|                                                      T3MACO.mq4  |
//|                                                          Perky_z |
//| http://groups.yahoo.com/group/MetaTrader_Experts_and_Indicators/ |
//+------------------------------------------------------------------+
#property copyright "Perky_z hack of Mojos Program"
#property link      "http://groups.yahoo.com/group/MetaTrader_Experts_and_Indicators/"

#property indicator_separate_window
#property indicator_buffers 1
#property indicator_color1 Red

extern int MA_Period = 5;
extern double b = 0.7;

double MapBuffer[];
extern int FastEMA=5;
extern int SlowEMA=8;
double e1,e2,e3,e4,e5,e6;
double c1,c2,c3,c4;
double n,w1,w2,b2,b3;

//+------------------------------------------------------------------+
//| Custom indicator initialization function                         |
//+------------------------------------------------------------------+
int init()
  {
//---- indicators setting
    SetIndexStyle(0,DRAW_LINE,STYLE_SOLID,1,Red);
    IndicatorDigits(MarketInfo(Symbol(),MODE_DIGITS));
    IndicatorShortName("T3_ MACO "+MA_Period);

    SetIndexBuffer(0,MapBuffer);

//---- variable reset

    e1=0; e2=0; e3=0; e4=0; e5=0; e6=0;
    c1=0; c2=0; c3=0; c4=0;
    n=0;
    w1=0; w2=0;
    b2=0; b3=0;

    b2=b*b;
    b3=b2*b;
    c1=-b3;
    c2=(3*(b2+b3));
    c3=-3*(2*b2+b+b3);
    c4=(1+3*b+b3+3*b2);
    n=MA_Period;

    if (n<1) n=1;
    n = 1 + 0.5*(n-1);
    w1 = 2 / (n + 1);
    w2 = 1 - w1;

//----
    return(0);
  }

//+------------------------------------------------------------------+
//| Custom indicator iteration function                              |
//+------------------------------------------------------------------+
int start()
  {
   int limit=Bars;

//---- indicator calculation

    for(int i=limit; i>=0; i--)
    {
        e1 = w1*(iMA(NULL,0,FastEMA,0,MODE_EMA,PRICE_CLOSE,i)-iMA(NULL,0,SlowEMA,0,MODE_EMA,PRICE_OPEN,i)) + w2*e1;
        e2 = w1*e1 + w2*e2;
        e3 = w1*e2 + w2*e3;
        e4 = w1*e3 + w2*e4;
        e5 = w1*e4 + w2*e5;
        e6 = w1*e5 + w2*e6;

        MapBuffer[i]=c1*e6 + c2*e5 + c3*e4 + c4*e3;
    }
//----
   return(0);
  }
//+------------------------------------------------------------------+
Comments