0 MA_of_MA cw
Download script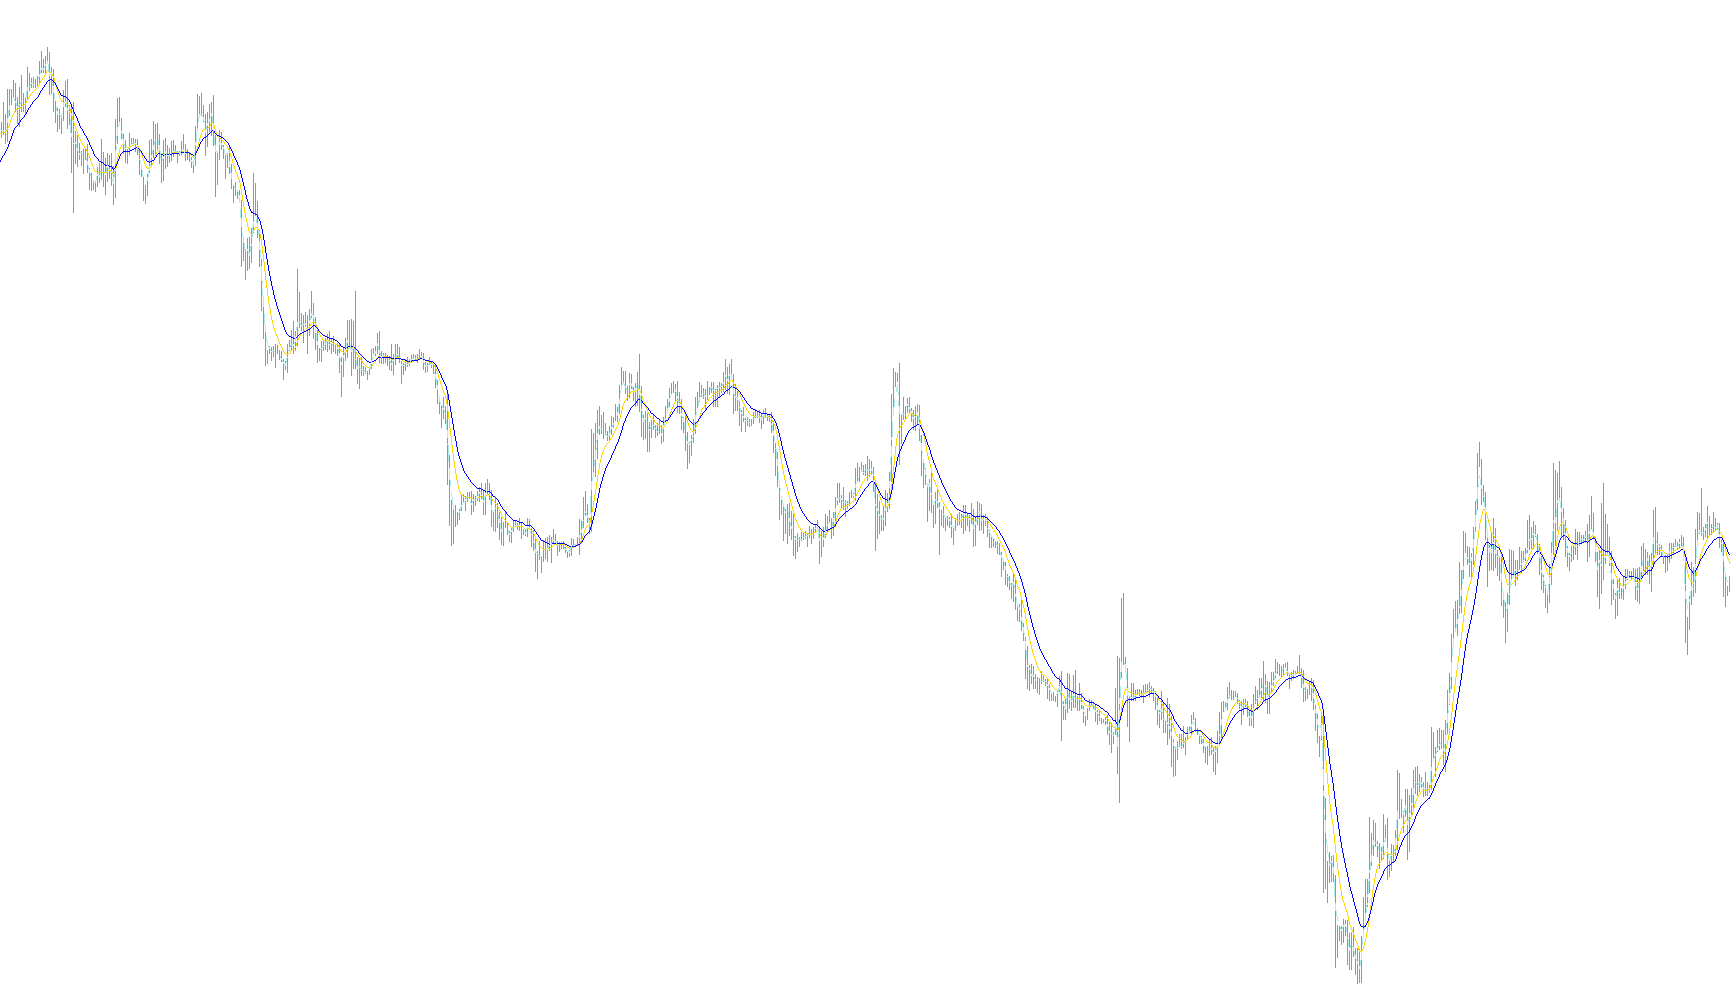
This script is designed as a multi-layered technical analysis tool for the MetaTrader platform. Its primary purpose is to smooth out price fluctuations by calculating a "Moving Average of a Moving Average." Instead of looking at raw market prices, which can be volatile and noisy, this tool creates layers of data to help identify underlying trends more clearly.
How the Logic Works
The script operates through a three-step hierarchical calculation process:
1. The Base Layer (Primary Calculation) First, the script identifies the core moving average. It looks at the raw price data (such as the closing price or high/low averages) over a specific number of candles. Depending on your settings, it can calculate this using different smoothing techniques (like Simple, Exponential, Smoothed, or Linear weighted averages). This creates the first "smoothed" line on your chart.
2. The Secondary Layer (Smoothing the Smooth) Rather than applying another indicator to the raw price, the script takes the results from the first moving average and calculates a second moving average on top of it. This acts as a filter, removing smaller price "jitters" and providing a much more stable line that represents the medium-term momentum.
3. The Tertiary Layer (Extended Smoothing) The logic repeats one final time. It takes the results of the second calculation and applies a third moving average to them. This creates a long-term trend line. By layering these three calculations, the script provides a visual representation of the market's "true" direction, filtered through multiple levels of mathematical smoothing.
Visual Presentation
The tool generates three distinct lines on your trading chart:
- Line 1: The first smoothed average (representing the shortest trend).
- Line 2: The second smoothed average (representing a mid-level trend).
- Line 3: The third smoothed average (represented by a dashed line, highlighting the broader, long-term direction).
Key Functionalities for the User
- Timeframe Flexibility: You can choose to view these averages on the current chart or automatically pull data from different timeframes (like 1-hour or 4-hour charts) while staying on your current screen.
- Customizable Math: You have the ability to change the calculation method (e.g., switching from a simple average to a weighted one) and the specific "Price Source" used for the initial calculation.
- Multi-Period Tracking: Each of the three layers can be assigned different periods, allowing you to visualize multiple time horizons simultaneously—from fast-moving price action to slow-moving structural trends.
//+------------------------------------------------------------------+
//|                                                     MA_of_MA.mq4 |
//|                                                                  |
//|                                                                  |
//+------------------------------------------------------------------+
#property copyright "Wolfe"
#property link ""

#property indicator_chart_window
//#property indicator_minimum 0
//#property indicator_maximum 100
//#property indicator_level1  20
//#property indicator_level2  80
#property indicator_buffers 3
#property indicator_color1 Yellow
#property indicator_color2 Blue
#property indicator_color3 Red

extern int  MA_Timeframe=0;//0=current chart,1=m1,5=m5,15=m15,30=m30,60=h1,240=h4,etc...
extern int  MA_Period =3;
extern int  MA_Method=1;// 0=SMA, 1=EMA, 2=SMMA, 3=LWMA
extern int  MA_Applied_Price=0;//0=close, 1=open, 2=high, 3=low, 4=(high+low)/2, 5=(high+low+close)/3, 6=(high+low+close+close)/4
extern int  MA1_of_MA_Period = 7;
extern int  MA1_of_MA_Method = 1;// 0=SMA, 1=EMA, 2=SMMA, 3=LWMA
extern int  MA2_of_MA_Period = 14;
extern int  MA2_of_MA_Method = 1;// 0=SMA, 1=EMA, 2=SMMA, 3=LWMA

double MA1_Array[],MA2_Array[],MA[];

//+------------------------------------------------------------------+
//| Custom indicator initialization function |
//+------------------------------------------------------------------+
int init()
{
//---- indicators setting
SetIndexStyle(0,DRAW_LINE,STYLE_SOLID,1);
SetIndexStyle(1,DRAW_LINE,STYLE_SOLID,1);
SetIndexStyle(2,DRAW_LINE,STYLE_DASH,1);

IndicatorDigits(MarketInfo(Symbol(),MODE_DIGITS));
IndicatorShortName("MA_of_MA "+MA_Timeframe);

SetIndexBuffer(0,MA1_Array);
SetIndexLabel(0,"MA1-MA "+MA1_of_MA_Period);

SetIndexBuffer(1,MA2_Array);
SetIndexLabel(1,"MA2-MA "+MA2_of_MA_Period);

SetIndexBuffer(2,MA);
SetIndexLabel(2,"MA "+MA_Period);

return(0);
}

//+------------------------------------------------------------------+
//| Custom indicator iteration function |
//+------------------------------------------------------------------+
int start()
{
int limit = Bars - IndicatorCounted() - 1;

//---- indicator calculation

   for(int i=limit; i>=0; i--)
   {
    MA[i] = iMA(NULL,MA_Timeframe,MA_Period,0,MA_Method,MA_Applied_Price,i);
   }

   for(i=limit; i>=0; i--)
   {
    MA1_Array[i] = iMAOnArray(MA,0,MA1_of_MA_Period,0,MA1_of_MA_Method,i);
    MA2_Array[i] = iMAOnArray(MA,0,MA2_of_MA_Period,0,MA2_of_MA_Method,i);
   }
//----
return(0);
}
//+------------------------------------------------------------------+
Comments