t3_adx_+di_-di_burst_v2
Download script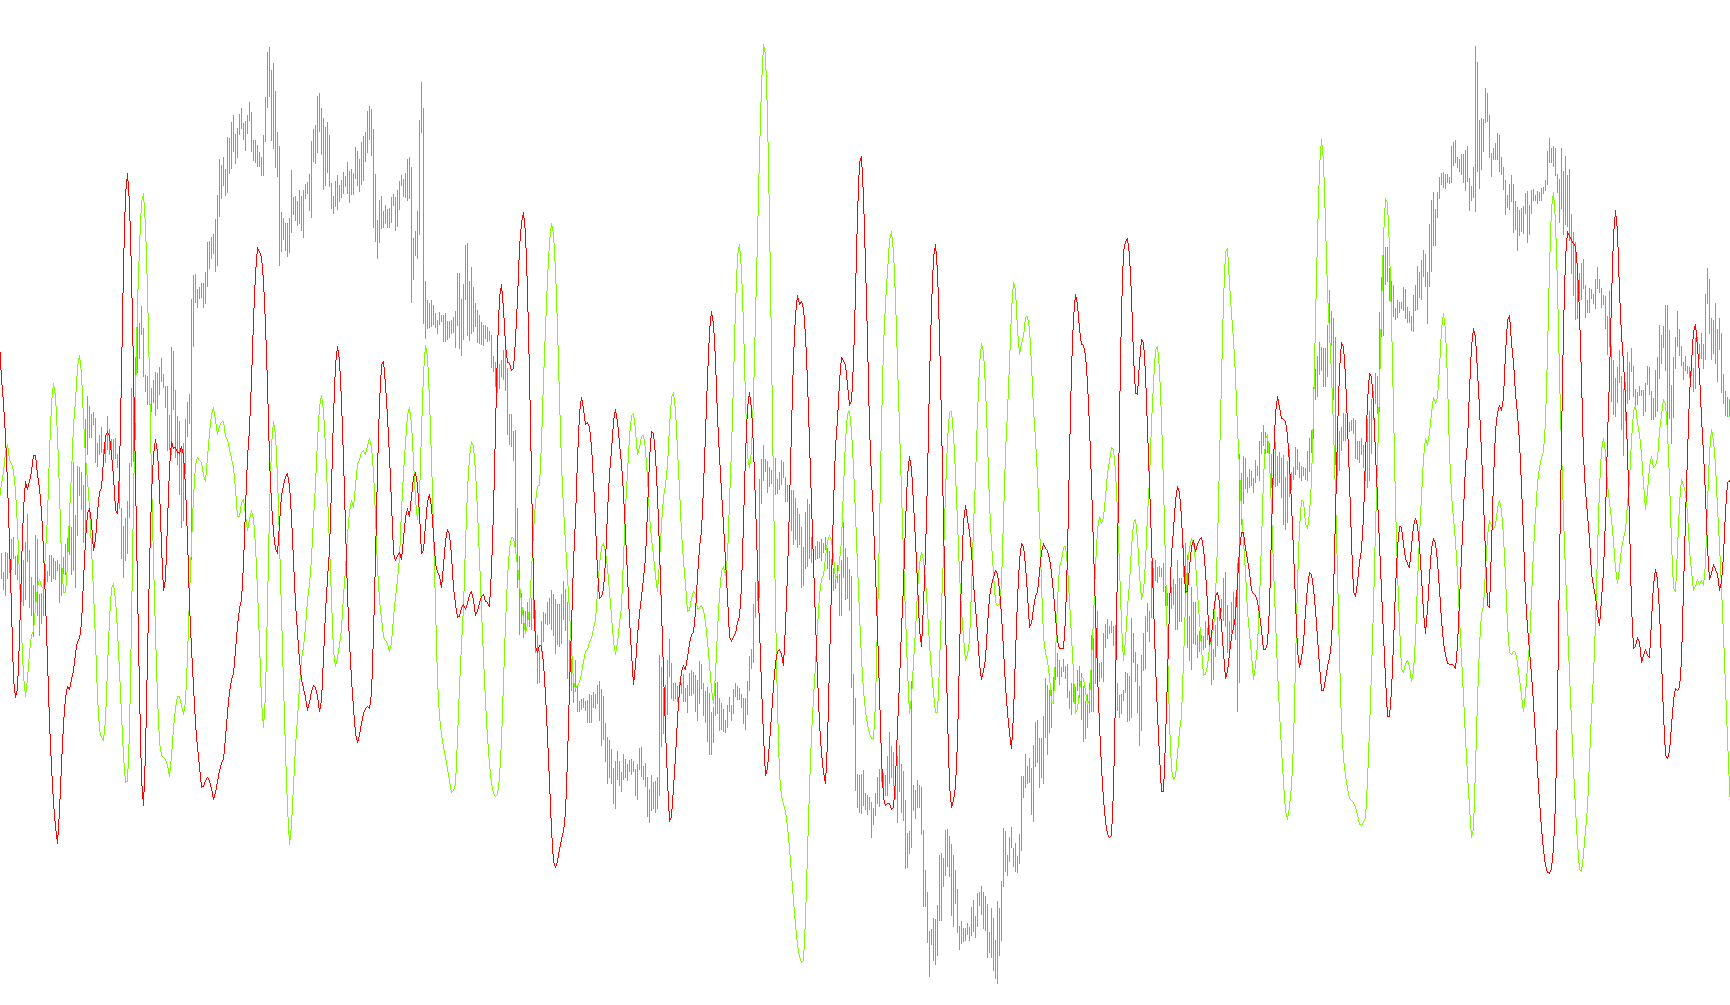
This script is a specialized technical analysis tool designed to help traders visualize and interpret market momentum and direction. Instead of looking at raw price action, it processes specific types of movement data to provide a clearer picture of the "push" behind a currency or asset's price.
How the Logic Works
1. Core Data Input (ADX Components) The tool begins by pulling two primary components from the ADX (Average Directional Index) system:
- Plus DI (+DI): Represents the strength of upward price movement.
- Minus DI (-DI): Represents the strength of downward price movement.
By isolating these, the script can distinguish between bullish (buying) pressure and bearish (selling) pressure independently.
2. The Smoothing Process (T3 Filtering) To prevent the data from being too "jittery" or reacting to minor market noise, the script applies a sophisticated filtering technique known as the T3 moving average.
Think of this like a high-quality lens: it cleans up the jagged edges of the raw data while maintaining a very responsive curve. It uses a specific mathematical weight (the "T3 Period") to ensure that the resulting lines stay smooth enough for human interpretation but fast enough to reflect real-time market shifts.
3. Momentum Amplification The logic performs several layers of recursive calculation. This means it doesn't just look at where the price is now; it looks at how the momentum has evolved over a sequence of steps. By calculating these multi-layered averages, the tool highlights "bursts"—sudden, significant shifts in momentum that might be harder to see on a standard chart.
4. Visual Output The final result is displayed as two distinct lines on a separate window:
- Lawn Green Line: Represents the filtered strength of upward momentum.
- Red Line: Represents the filtered strength of downward momentum.
Summary for the User
When you use this tool, you aren't looking at prices; you are looking at the intensity of the trend. When one line moves significantly higher than the other, it signals which direction the market "weight" is shifting. Because it uses the T3 logic, these lines are designed to be cleaner and more reliable than standard indicators, helping you identify where the real strength lies without being distracted by minor price fluctuations.
//+-------------------------------------------------------------------------+
//| t3_adx_+di_-di_burst.mq4                                                |
//| Copyright © 2005,                                                       |
//| http://finance.groups.yahoo.com/group/MetaTrader_Experts_and_Indicators/|
//+-------------------------------------------------------------------------+
#property copyright "Copyright © 2005,"
#property link      "http://finance.groups.yahoo.com/group/MetaTrader_Experts_and_Indicators/"
//----
#property indicator_separate_window
#property indicator_buffers 2
#property indicator_color1 LawnGreen
#property indicator_color2 Red
#property indicator_level1 0
//-----
extern int adxPeriods=10;
extern int T3_Period=10;
extern double b=-0.382;
//----
double MapBuffer[];
double e1,e2,e3,e4,e5,e6;
double c1,c2,c3,c4;
double n,w1,w2,b2,b3;
double MapBuffer1[];
double ae1,ae2,ae3,ae4,ae5,ae6;
double ac1,ac2,ac3,ac4;
double an,aw1,aw2,ab2,ab3;
//+------------------------------------------------------------------+
//| Custom indicator initialization function                         |
//+------------------------------------------------------------------+
int init()
  {
//---- indicators setting
   SetIndexStyle(0,DRAW_LINE,STYLE_SOLID,1,LawnGreen);
   SetIndexStyle(1,DRAW_LINE,STYLE_SOLID,1,Red);
   IndicatorDigits(MarketInfo(Symbol(),MODE_DIGITS));
   IndicatorShortName("t3_adx_+di_-di_burst "+T3_Period);
   SetIndexBuffer(0,MapBuffer);
   SetIndexBuffer(1,MapBuffer1);
//---- variable reset
   e1=0; e2=0; e3=0; e4=0; e5=0; e6=0;
   c1=0; c2=0; c3=0; c4=0;
   n=0;
   w1=0; w2=0;
   b2=0; b3=0;
   b2=b*b;
   b3=b2*b;
   c1=-b3;
   c2=(3*(b2+b3));
   c3=-3*(2*b2+b+b3);
   c4=(1+3*b+b3+3*b2);
   n=T3_Period;
//----
   if (n<1) n=1;
   n=1 + (0.5*(n-1));
   w1=2/(n + 1);
   w2=1 - w1;
//----
   ae1=0; ae2=0; ae3=0; ae4=0; ae5=0; ae6=0;
   ac1=0; ac2=0; ac3=0; ac4=0;
   an=0;
   aw1=0; aw2=0;
   ab2=0; ab3=0;
   ab2=b*b;
   ab3=ab2*b;
   ac1=-ab3;
   ac2=(3*(ab2+ab3));
   ac3=-3*(2*ab2+b+ab3);
   ac4=(1+3*b+ab3+3*ab2);
   an=T3_Period;
//----
   if (an<1) an=1;
   an=1 + (0.5*(an-1));
   aw1=2/(an + 1);
   aw2=1 - aw1;
//----
   return(0);
  }
//+------------------------------------------------------------------+
//| Custom indicator iteration function                              |
//+------------------------------------------------------------------+
int start()
  {
   int limit=2000;
//---- indicator calculation
   for(int i=limit; i>=0; i--)
     {
      e1=((w1*(iADX(Symbol(),0,adxPeriods,PRICE_CLOSE,MODE_PLUSDI,i)-iADX(Symbol(),0,adxPeriods,PRICE_CLOSE,MODE_PLUSDI,i+1))) + w2*e1);
      e2=((w1*e1) + w2*e2);
      e3=((w1*e2) + w2*e3);
      e4=((w1*e3) + w2*e4);
      e5=((w1*e4) + w2*e5);
      e6=((w1*e5) + w2*e6);
//----
      MapBuffer[i]=((((c1*e6) + c2*e5) + c3*e4) + c4*e3)*1000;
//----
      ae1=((aw1*(iADX(Symbol(),0,adxPeriods,PRICE_CLOSE,MODE_MINUSDI,i)-iADX(Symbol(),0,adxPeriods,PRICE_CLOSE,MODE_MINUSDI,i+1))) + aw2*ae1);
      ae2=((aw1*ae1) + aw2*ae2);
      ae3=((aw1*ae2) + aw2*ae3);
      ae4=((aw1*ae3) + aw2*ae4);
      ae5=((aw1*ae4) + aw2*ae5);
      ae6=((aw1*ae5) + aw2*ae6);
//----
      MapBuffer1[i]=((((ac1*ae6) + ac2*ae5) + ac3*ae4) + ac4*ae3)*1000;
     }
//----
   return(0);
  }
//+------------------------------------------------------------------+
Comments