t3_adx_+di_-di_burst
Download script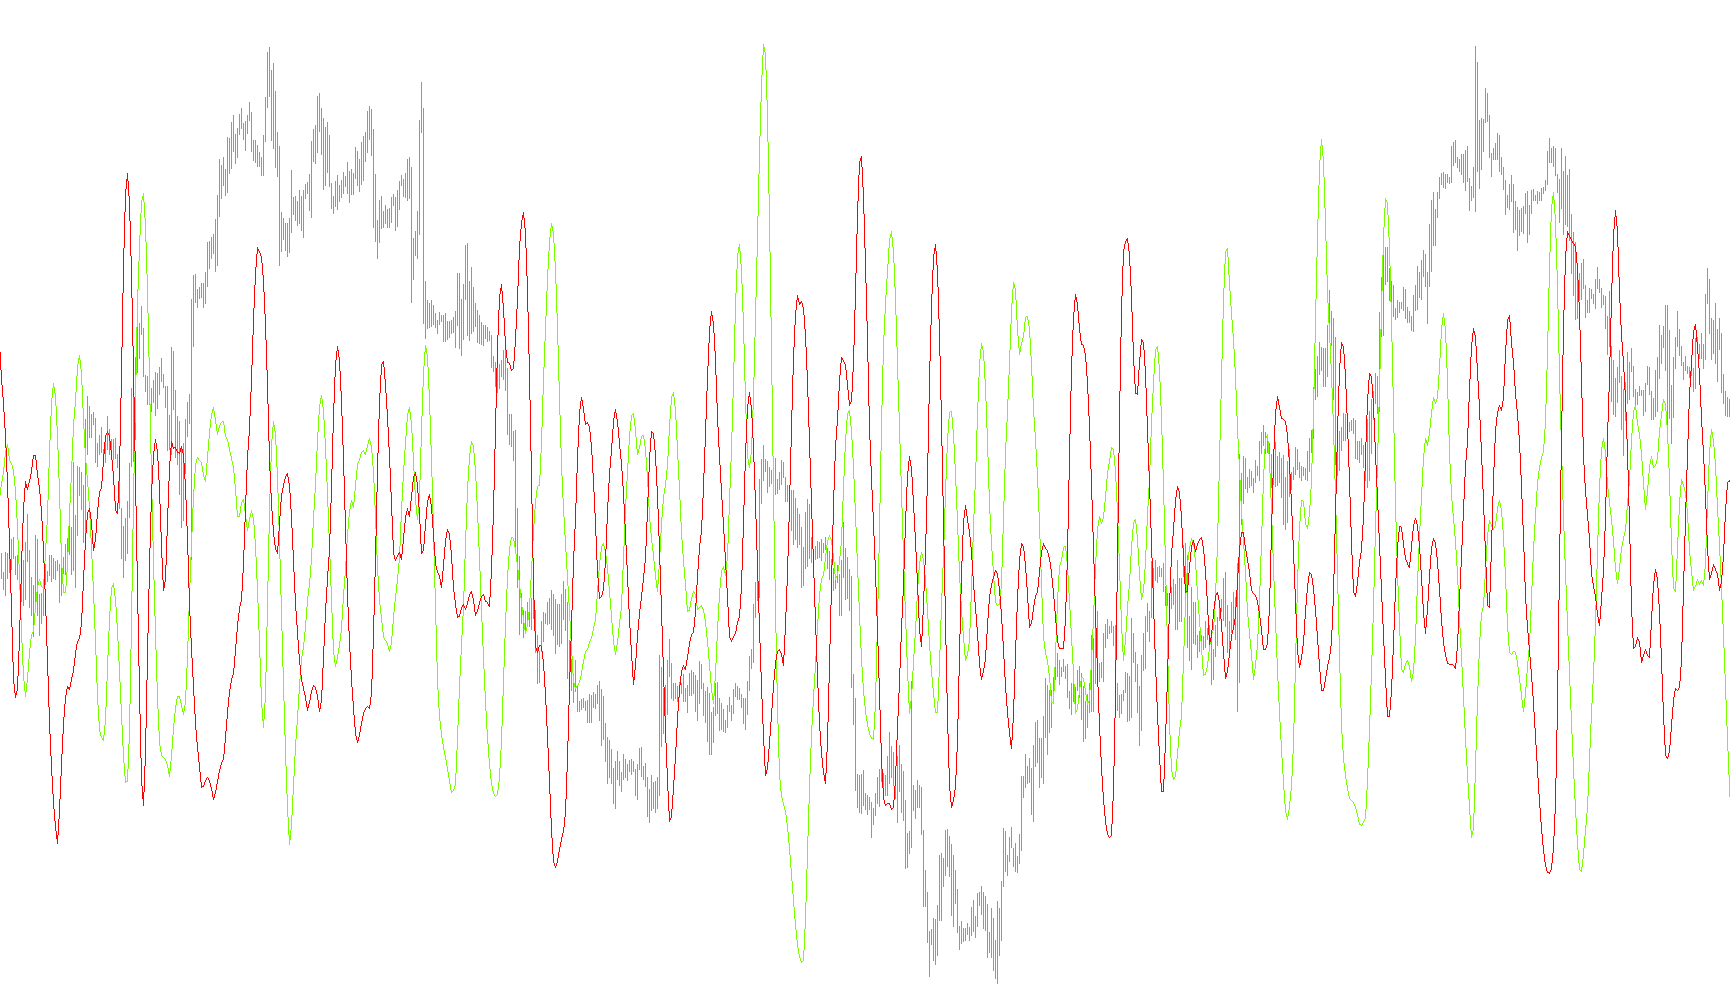
This tool is designed to analyze and visualize market momentum by filtering out "noise" from standard price movements. It specifically focuses on identifying the strength and direction of trends using a sophisticated smoothing technique.
Core Logic Overview
The script operates by looking at two primary components of market movement: the Positive Directional Indicator (+DI), which tracks upward price pressure, and the Negative Directional Indicator (-DI), which tracks downward pressure.
Rather than showing these raw signals directly—which can often be erratic and jumpy—the script applies a multi-layered mathematical filter to create a smoother, more reliable "burst" of data.
How it Processes Information
The logic follows a specific sequence to arrive at the final visual result:
- Input Tracking: The tool monitors the price changes over a set number of periods to determine how much "push" is behind the current trend (up or down).
- Multi-Stage Smoothing: It uses a technique called "T3," which involves running the data through six successive layers of calculations. Each layer acts like a sieve, refining the signal and removing minor fluctuations. This ensures that the resulting line on your chart represents a significant shift in momentum rather than a momentary spike.
- Weighted Calculation: The script applies specific coefficients (weights) to these layers. These weights are balanced to ensure the indicator remains responsive enough to capture new trends quickly while remaining stable enough to avoid false signals during periods of consolidation.
- Dual Output: The final result is presented as two distinct lines:
- The Green Line: Represents the smoothed, refined upward momentum.
- The Red Line: Represents the smoothed, refined downward momentum.
Practical Interpretation
By using this logic, the script aims to provide a clearer picture of where the "real" trend is heading. Instead of seeing every small wiggle in the price, you see a stabilized representation of strength. When these lines show significant movement, it indicates a purposeful directional shift in the market, allowing for a more disciplined view of trend intensity.
//+-------------------------------------------------------------------------+
//| t3_adx_+di_-di_burst.mq4                                                |
//| Copyright © 2005,                                                       |
//| http://finance.groups.yahoo.com/group/MetaTrader_Experts_and_Indicators/|
//+-------------------------------------------------------------------------+
#property copyright "Copyright © 2005,"
#property link      "http://finance.groups.yahoo.com/group/MetaTrader_Experts_and_Indicators/"

#property indicator_separate_window
#property indicator_buffers 2
#property indicator_color1 LawnGreen
#property indicator_color2 Red
#property indicator_level1 0

extern int adxPeriods = 10;
extern int T3_Period = 10;
extern double b = -0.382;

double MapBuffer[];
double e1,e2,e3,e4,e5,e6;
double c1,c2,c3,c4;
double n,w1,w2,b2,b3;
double MapBuffer1[];
double ae1,ae2,ae3,ae4,ae5,ae6;
double ac1,ac2,ac3,ac4;
double an,aw1,aw2,ab2,ab3;

//+------------------------------------------------------------------+
//| Custom indicator initialization function                         |
//+------------------------------------------------------------------+
int init()
  {
//---- indicators setting
    SetIndexStyle(0,DRAW_LINE,STYLE_SOLID,1,LawnGreen);
    SetIndexStyle(1,DRAW_LINE,STYLE_SOLID,1,Red);
    IndicatorDigits(MarketInfo(Symbol(),MODE_DIGITS));
    IndicatorShortName("t3_adx_+di_-di_burst "+T3_Period);

    SetIndexBuffer(0,MapBuffer);
    SetIndexBuffer(1,MapBuffer1);

//---- variable reset

    e1=0; e2=0; e3=0; e4=0; e5=0; e6=0;
    c1=0; c2=0; c3=0; c4=0;
    n=0;
    w1=0; w2=0;
    b2=0; b3=0;

    b2=b*b;
    b3=b2*b;
    c1=-b3;
    c2=(3*(b2+b3));
    c3=-3*(2*b2+b+b3);
    c4=(1+3*b+b3+3*b2);
    n=T3_Period;

    if (n<1) n=1;
    n = 1 + (0.5*(n-1));
    w1 = 2 / (n + 1);
    w2 = 1 - w1;

    ae1=0; ae2=0; ae3=0; ae4=0; ae5=0; ae6=0;
    ac1=0; ac2=0; ac3=0; ac4=0;
    an=0;
    aw1=0; aw2=0;
    ab2=0; ab3=0;

    ab2=b*b;
    ab3=ab2*b;
    ac1=-ab3;
    ac2=(3*(ab2+ab3));
    ac3=-3*(2*ab2+b+ab3);
    ac4=(1+3*b+ab3+3*ab2);
    an=T3_Period;

    if (an<1) an=1;
    an = 1 + (0.5*(an-1));
    aw1 = 2 / (an + 1);
    aw2 = 1 - aw1;

//----
    return(0);
  }

//+------------------------------------------------------------------+
//| Custom indicator iteration function                              |
//+------------------------------------------------------------------+
int start()
  {
   int limit=2000;

//---- indicator calculation

    for(int i=limit; i>=0; i--)
    {
        e1 = ((w1*(iADX(Symbol(),0,adxPeriods,PRICE_CLOSE,MODE_PLUSDI,i)-iADX(Symbol(),0,adxPeriods,PRICE_CLOSE,MODE_PLUSDI,i+1))) + w2*e1);
        e2 = ((w1*e1) + w2*e2);
        e3 = ((w1*e2) + w2*e3);
        e4 = ((w1*e3) + w2*e4);
        e5 = ((w1*e4) + w2*e5);
        e6 = ((w1*e5) + w2*e6);

        MapBuffer[i]=((((c1*e6) + c2*e5) + c3*e4) + c4*e3)*1000;

        ae1 = ((aw1*(iADX(Symbol(),0,adxPeriods,PRICE_CLOSE,MODE_MINUSDI,i)-iADX(Symbol(),0,adxPeriods,PRICE_CLOSE,MODE_MINUSDI,i+1))) + aw2*ae1);
        ae2 = ((aw1*ae1) + aw2*ae2);
        ae3 = ((aw1*ae2) + aw2*ae3);
        ae4 = ((aw1*ae3) + aw2*ae4);
        ae5 = ((aw1*ae4) + aw2*ae5);
        ae6 = ((aw1*ae5) + aw2*ae6);

        MapBuffer1[i]=((((ac1*ae6) + ac2*ae5) + ac3*ae4) + ac4*ae3)*1000;
    }
//----
   return(0);
  }
//+------------------------------------------------------------------+
Comments