(T_S_R)-BAR Trend
Download script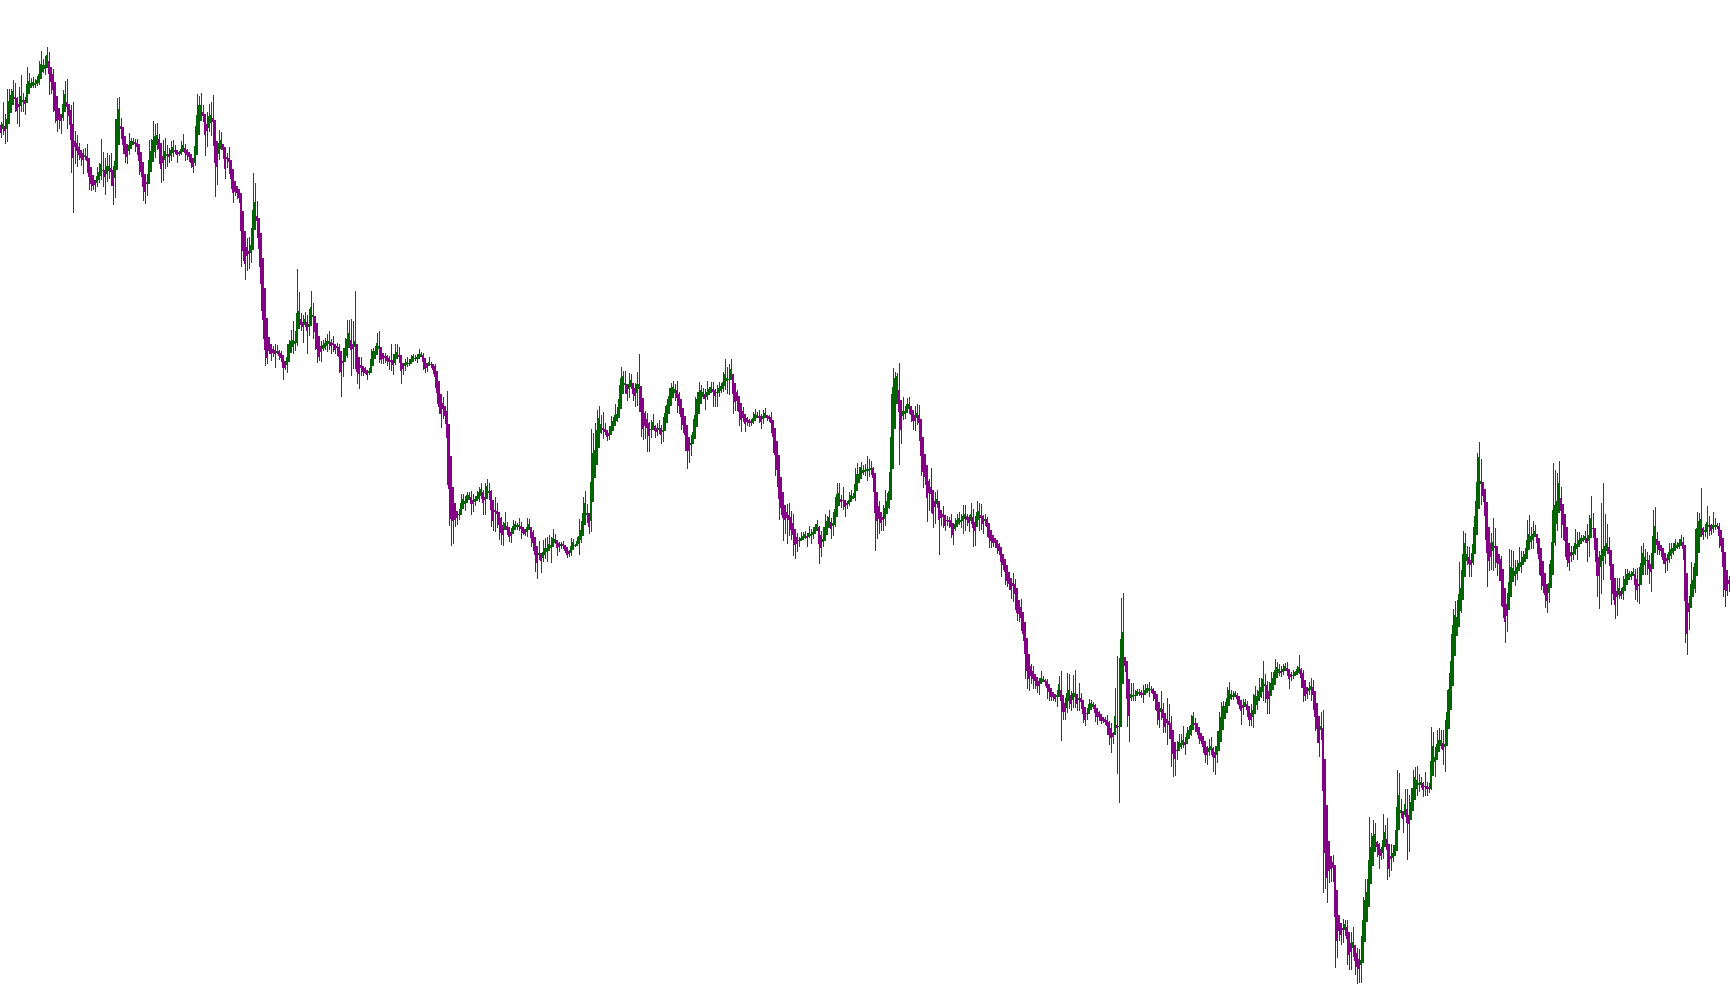
This script is a specialized financial charting tool designed to transform standard price action into Heiken Ashi bars. Unlike traditional Japanese candlesticks, which show the raw price movements of a specific time period, Heikin Ashi bars are designed to "smooth out" price noise to provide a clearer picture of the underlying trend.
How the Logic Works
The script works by recalculating the price data on your chart using a customized mathematical formula. Instead of plotting the exact highs and lows of every price tick, it processes the data in three specific steps:
1. Smoothing the Price (Opening and Closing) The tool creates new "synthetic" values for the price bars:
- The Average Close: It calculates a new closing price by averaging the current bar's high, low, open, and close. This helps filter out erratic spikes in price.
- The Balanced Open: It determines the starting point of the bar by taking the average of the previous bar’s synthetic open and close. This ensures that the "opening" of one bar flows logically from where the last one ended, creating a more continuous visual flow.
2. Determining the Boundaries (Highs and Lows) Once the smoothed open and close values are established, the script looks at the actual market highs and lows for that period. It then selects the highest and lowest points between the actual price limits and the newly calculated synthetic values. This ensures that while the trend is smoothed, the bar still respects the extreme boundaries reached by the market.
3. Visual Representation (Color and Direction) Finally, the script organizes these values into a visual format:
- If the smoothed closing price is higher than the smoothed opening price, it represents upward momentum.
- If the smoothed closing price is lower than the smoothed opening price, it represents downward momentum.
The Goal for the Trader
The primary objective of this logic is Trend Clarity. By moving away from the "jagged" nature of raw price data and using these averages, the script helps traders identify the direction of the market more easily. It filters out minor fluctuations (noise) so that you can better visualize whether the market is in a sustained uptrend, a downtrend, or a period of consolidation.
//+------------------------------------------------------------------+
//|                                                  Heiken Ashi.mq4 |
//|                      Copyright c 2004, MetaQuotes Software Corp. |
//|                                        http://www.metaquotes.net
//| Personalized by iGoR for the Trend Slope Trading method (T_S_T)
//| Link: http://www.strategybuilderfx.com/forums/showthread.php?t=16507
//| contact: igor@igor.cc
//+------------------------------------------------------------------+
//| For Heiken Ashi we recommend next chart settings ( press F8 or   |
//| select on menu 'Charts'->'Properties...'):                       |
//|  - On 'Color' Tab select 'Black' for 'Line Graph'                |
//|  - On 'Common' Tab disable 'Chart on Foreground' checkbox and    |
//|    select 'Line Chart' radiobutton                               |
//+------------------------------------------------------------------+
#property copyright "Copyright © 2004, MetaQuotes Software Corp."
#property link      "http://www.metaquotes.net"

#property indicator_chart_window
#property indicator_buffers 4
#property indicator_color1 DimGray
#property indicator_color2 DarkGray
#property indicator_color3 DimGray
#property indicator_color4 DarkGray
//---- buffers
double ExtMapBuffer1[];
double ExtMapBuffer2[];
double ExtMapBuffer3[];
double ExtMapBuffer4[];
//----
int ExtCountedBars=0;
//+------------------------------------------------------------------+
//| Custom indicator initialization function                         |
//|------------------------------------------------------------------|
int init()
  {
//---- indicators
   SetIndexStyle(0,DRAW_HISTOGRAM, 0, 1, Purple);
   SetIndexBuffer(0, ExtMapBuffer1);
   SetIndexStyle(1,DRAW_HISTOGRAM, 0, 1, DarkGreen);
   SetIndexBuffer(1, ExtMapBuffer2);
   SetIndexStyle(2,DRAW_HISTOGRAM, 0, 3, Purple);
   SetIndexBuffer(2, ExtMapBuffer3);
   SetIndexStyle(3,DRAW_HISTOGRAM, 0, 3, DarkGreen);
   SetIndexBuffer(3, ExtMapBuffer4);
//----
   SetIndexDrawBegin(0,10);
   SetIndexDrawBegin(1,10);
   SetIndexDrawBegin(2,10);
   SetIndexDrawBegin(3,10);
//---- indicator buffers mapping
   SetIndexBuffer(0,ExtMapBuffer1);
   SetIndexBuffer(1,ExtMapBuffer2);
   SetIndexBuffer(2,ExtMapBuffer3);
   SetIndexBuffer(3,ExtMapBuffer4);
//---- initialization done
   return(0);
  }
//+------------------------------------------------------------------+
//| Custom indicator deinitialization function                       |
//+------------------------------------------------------------------+
int deinit()
  {
//---- TODO: add your code here

//----
   return(0);
  }
//+------------------------------------------------------------------+
//| Custom indicator iteration function                              |
//+------------------------------------------------------------------+
int start()
  {
   double haOpen, haHigh, haLow, haClose;
   if(Bars<=10) return(0);
   ExtCountedBars=IndicatorCounted();
//---- check for possible errors
   if (ExtCountedBars<0) return(-1);
//---- last counted bar will be recounted
   if (ExtCountedBars>0) ExtCountedBars--;
   int pos=Bars-ExtCountedBars-1;
   while(pos>=0)
     {
      haOpen=(ExtMapBuffer3[pos+1]+ExtMapBuffer4[pos+1])/2;
      haClose=(Open[pos]+High[pos]+Low[pos]+Close[pos])/4;
      haHigh=MathMax(High[pos], MathMax(haOpen, haClose));
      haLow=MathMin(Low[pos], MathMin(haOpen, haClose));
      if (haOpen<haClose)
        {
         ExtMapBuffer1[pos]=haLow;
         ExtMapBuffer2[pos]=haHigh;
        }
      else
        {
         ExtMapBuffer1[pos]=haHigh;
         ExtMapBuffer2[pos]=haLow;
        }
      ExtMapBuffer3[pos]=haOpen;
      ExtMapBuffer4[pos]=haClose;
 	   pos--;
     }
//----
   return(0);
  }
//+------------------------------------------------------------------+
Comments