Heiken Ashi_v2
Download script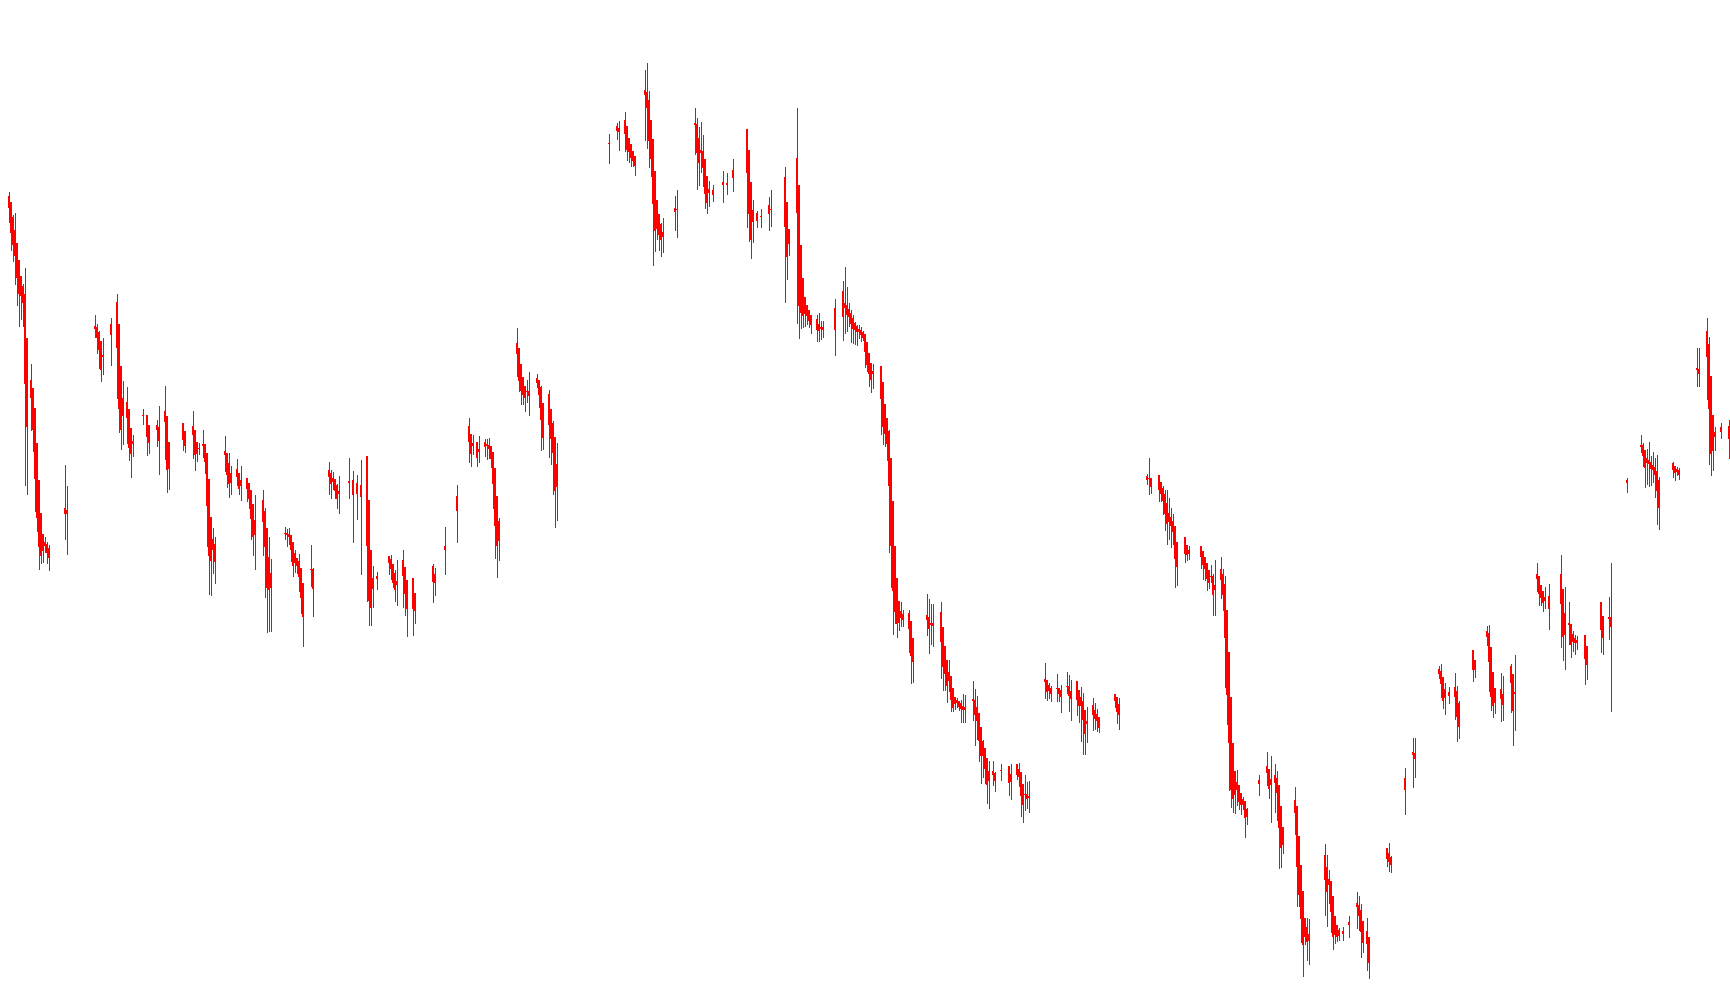
This script is designed to transform standard price chart data into a specialized visual format known as Heiken Ashi. Unlike traditional Japanese Candlestick charts, which represent the raw price action of each period (the exact open, high, low, and close), Heikin Ashi candles are designed to filter out "market noise" and provide a much smoother visual representation of price trends.
How the Logic Works
The core logic of this script involves a unique mathematical conversion. It does not simply display the market's real-time prices; instead, it recalculates four specific values for every bar on your chart:
- A Smoothed Opening Price: Instead of using the actual price where a period started, the script calculates a midpoint between the previous candle's opening and closing values. This creates a continuous flow, helping to identify the prevailing direction of the market.
- An Averaged Closing Price: The script takes the average of the current period's high, low, open, and close prices. By averaging these four points, it centers the data, making it easier to see the "true" average price for that timeframe.
- Dynamic Highs and Lows: To ensure the candles accurately reflect the extreme price movements, the script compares the actual market high and low against the newly calculated opening and closing prices. It then selects whichever values are the highest and lowest to define the boundaries of each candle.
Visual Behavior and Interpretation
The script translates these calculations into two distinct visual elements:
- Trend Filtering: Because the opening price is based on previous data, the candles often appear as "solid" blocks of color when a trend is strong. This allows traders to see the momentum more clearly than they would on a standard chart where every small price flicker causes a change in candle shape.
- Color Coding: The script uses a two-tone system (Red and White). By comparing the calculated opening price to the averaged closing price, it determines the sentiment:
- If the average close is higher than the smooth open, it represents upward momentum (White).
- If the average close is lower than the smooth open, it represents downward momentum (Red).
Summary for the User
In simple terms, this script acts as a "filter" for your trading view. It takes the chaotic movements of the market and re-calculates them into a smoother, more readable format. This helps you identify whether the overall trend is moving up or down without being distracted by minor, insignificant price fluctuations that occur within individual timeframes.
/*-----------------------------+
|			       |
| Shared by www.Aptrafx.com    |
|			       |
+------------------------------*/

//+------------------------------------------------------------------+
//|                                                  Heiken Ashi.mq4 |
//|                      Copyright c 2004, MetaQuotes Software Corp. |
//|                                        http://www.metaquotes.net |
//+------------------------------------------------------------------+
//| For Heiken Ashi we recommend next chart settings ( press F8 or   |
//| select on menu 'Charts'->'Properties...'):                       |
//|  - On 'Color' Tab select 'Black' for 'Line Graph'                |
//|  - On 'Common' Tab disable 'Chart on Foreground' checkbox and    |
//|    select 'Line Chart' radiobutton                               |
//+------------------------------------------------------------------+
#property copyright "Copyright © 2004, MetaQuotes Software Corp."
#property link      "http://www.metaquotes.net"

#property indicator_chart_window
#property indicator_buffers 4
#property indicator_color1 Red
#property indicator_color2 White
#property indicator_color3 Red
#property indicator_color4 White
//---- buffers
double ExtMapBuffer1[];
double ExtMapBuffer2[];
double ExtMapBuffer3[];
double ExtMapBuffer4[];
//----
int ExtCountedBars=0;
//+------------------------------------------------------------------+
//| Custom indicator initialization function                         |
//|------------------------------------------------------------------|
int init()
  {
//---- indicators
   SetIndexStyle(0,DRAW_HISTOGRAM, 0, 1, Red);
   SetIndexBuffer(0, ExtMapBuffer1);
   SetIndexStyle(1,DRAW_HISTOGRAM, 0, 1, White);
   SetIndexBuffer(1, ExtMapBuffer2);
   SetIndexStyle(2,DRAW_HISTOGRAM, 0, 3, Red);
   SetIndexBuffer(2, ExtMapBuffer3);
   SetIndexStyle(3,DRAW_HISTOGRAM, 0, 3, White);
   SetIndexBuffer(3, ExtMapBuffer4);
//----
   SetIndexDrawBegin(0,10);
   SetIndexDrawBegin(1,10);
   SetIndexDrawBegin(2,10);
   SetIndexDrawBegin(3,10);
//---- indicator buffers mapping
   SetIndexBuffer(0,ExtMapBuffer1);
   SetIndexBuffer(1,ExtMapBuffer2);
   SetIndexBuffer(2,ExtMapBuffer3);
   SetIndexBuffer(3,ExtMapBuffer4);
//---- initialization done
   return(0);
  }
//+------------------------------------------------------------------+
//| Custom indicator deinitialization function                       |
//+------------------------------------------------------------------+
int deinit()
  {
//---- TODO: add your code here

//----
   return(0);
  }
//+------------------------------------------------------------------+
//| Custom indicator iteration function                              |
//+------------------------------------------------------------------+
int start()
  {
   double haOpen, haHigh, haLow, haClose;
   if(Bars<=10) return(0);
   ExtCountedBars=IndicatorCounted();
//---- check for possible errors
   if (ExtCountedBars<0) return(-1);
//---- last counted bar will be recounted
   if (ExtCountedBars>0) ExtCountedBars--;
   int pos=Bars-ExtCountedBars-1;
   while(pos>=0)
     {
      haOpen=(ExtMapBuffer3[pos+1]+ExtMapBuffer4[pos+1])/2;
      haClose=(Open[pos]+High[pos]+Low[pos]+Close[pos])/4;
      haHigh=MathMax(High[pos], MathMax(haOpen, haClose));
      haLow=MathMin(Low[pos], MathMin(haOpen, haClose));
      if (haOpen<haClose)
        {
         ExtMapBuffer1[pos]=haLow;
         ExtMapBuffer2[pos]=haHigh;
        }
      else
        {
         ExtMapBuffer1[pos]=haHigh;
         ExtMapBuffer2[pos]=haLow;
        }
      ExtMapBuffer3[pos]=haOpen;
      ExtMapBuffer4[pos]=haClose;
 	   pos--;
     }
//----
   return(0);
  }
//+------------------------------------------------------------------+
Comments