SZZReader
Download script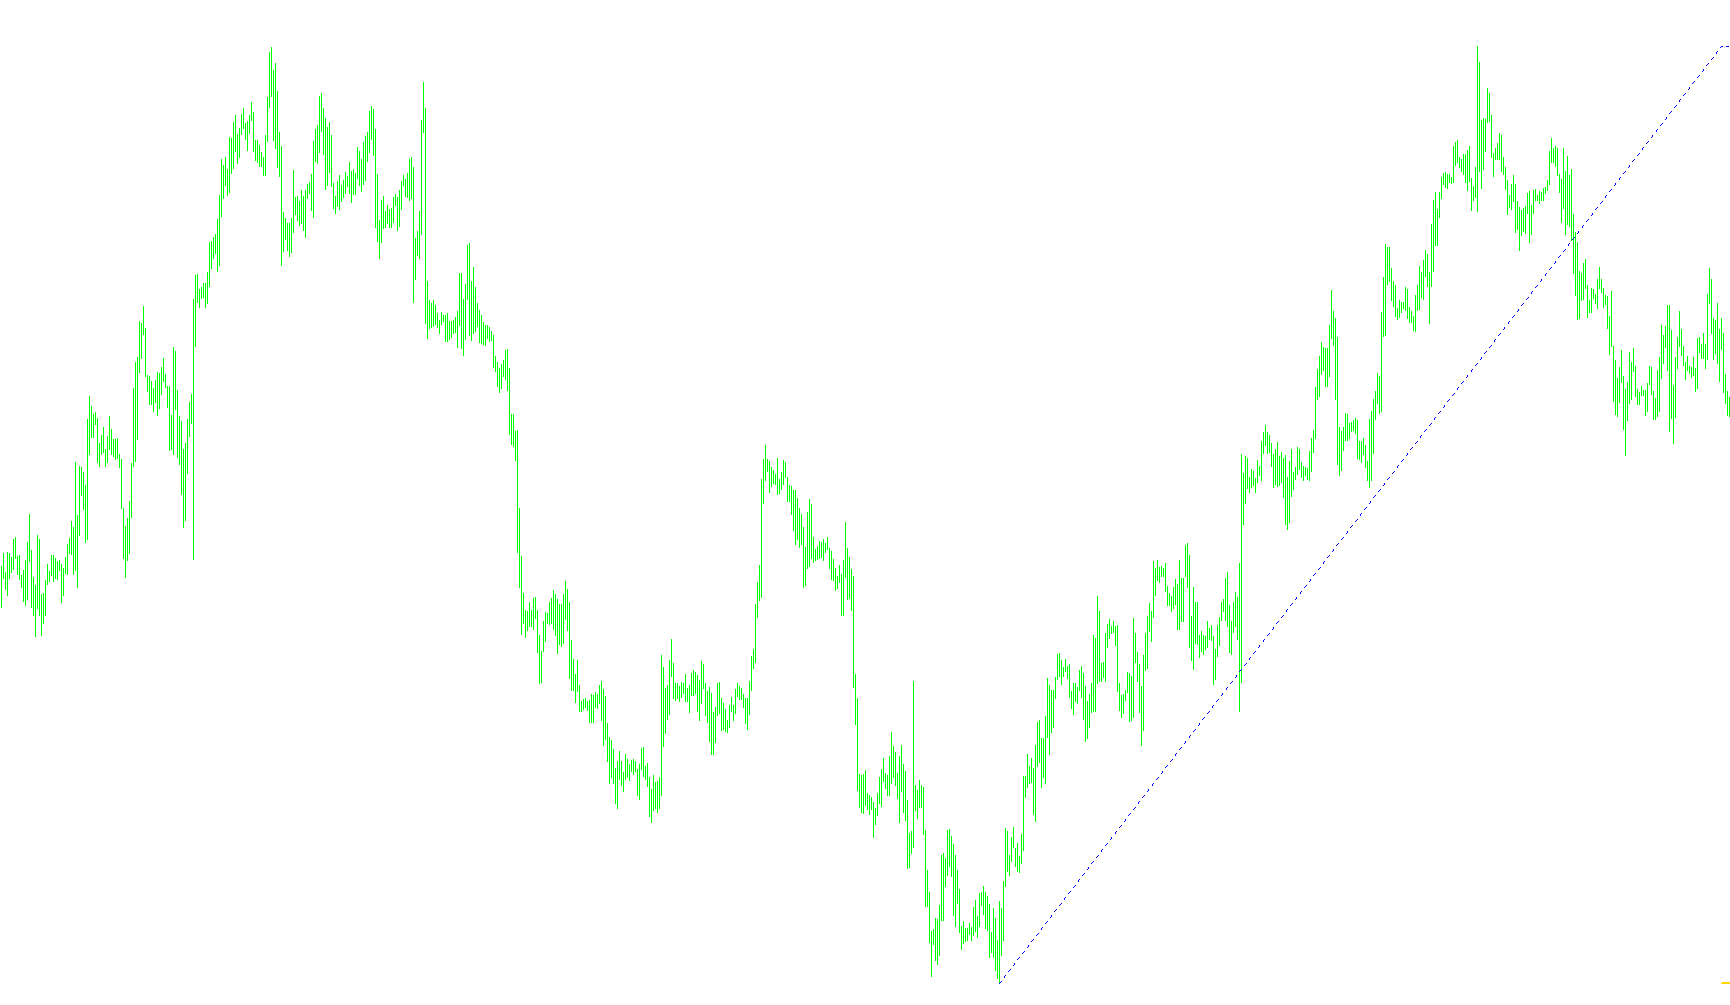
This tool is designed to visualize specific price action patterns on your trading charts by analyzing data from higher timeframes. It acts as a visual bridge, taking complex movements from a larger timeframe and projecting them onto your current viewing window.
Core Logic Overview
The script operates by scanning for significant "turning points" in the market based on a secondary indicator (SZZ). Instead of looking at every single price tick, it focuses on a set number of these key signals to determine the overall structure of the market trend.
Key functional steps include:
- Timeframe Synchronization: The tool looks at a "Senior" timeframe (a larger time scale than the one you are currently viewing). It ensures that the data it gathers is significant enough to provide a meaningful overview of the market's direction.
- Signal Filtering: You can customize how many previous signals the script should consider. By default, it looks at a specific range of historical signals (capped at a maximum of 20) to identify recent peaks and valleys.
- High and Low Identification: Once the script identifies a signal from the higher timeframe, it automatically determines whether that move was an upward push or a downward pull. It then searches for the highest high or the lowest low within that specific period.
- Dynamic Mapping: The tool performs a "shift" calculation. Since the signals come from a larger timeframe, the script calculates exactly where those historical peaks and valleys align with your current smaller timeframe candles. This allows it to draw lines accurately on your screen.
Visual Output
The script produces two primary visual components:
- SnakeZZ: A line that connects these identified highs and lows, creating a "path" or "snake" of the market's structural movement.
- ZZRubberString: A dotted line that highlights specific segments of these movements, helping to distinguish between different phases of price action.
In summary, this script automates the process of identifying major historical price peaks and valleys from a higher timeframe and maps them onto your current chart to give you a clearer picture of the prevailing market structure.
//+------------+-----------------------------------------------------+
//| v.05.01.08 |                                       SZZReader.mq4 |
//|            |              Bookkeeper, 2008, yuzefovich@gmail.com |
//+------------+-----------------------------------------------------+
//  Íåîáõîäèìî íàëè÷èå SZZ_without_ZZ.mq4 v.05.01.08
//  Presence SZZ_without_ZZ.mq4 v.05.01.08 is necessary
//+------------+-----------------------------------------------------+
#property copyright ""
#property link      ""
#property indicator_chart_window
#property indicator_buffers 2
#property indicator_color1  Blue
#property indicator_color2  Blue
//----
extern int SeniorTF=60; // ÒÔ ðàñc÷åòà óçëîâ ÇèãÇàãà ( >=Period() ! )
extern int NUnits=10;  // ñ÷èòàòü êîëè÷åñòâî óçëîâ ÇèãÇàãà ( =20 max)
//----
double SnakeZZ[];
double ZZRubberString[];
//----
double NumBars[21];
double UpAndDn[21];
//----
bool first=true, firstAlert=true;
datetime StartTime;
int NDel=0;
//----
//+------------------------------------------------------------------+
void deinit()
{
   return;
}
//---------------------------------------------------------------------
int init()
{
int    draw_begin;
   IndicatorBuffers  (2);
   SetIndexBuffer    (0,SnakeZZ);
   SetIndexStyle     (0,DRAW_SECTION,EMPTY,2);
   SetIndexEmptyValue(0,0.0);
   SetIndexBuffer    (1,ZZRubberString);
   SetIndexStyle     (1,DRAW_SECTION,STYLE_DOT);
   SetIndexEmptyValue(1,0.0);
   return(0);
}
   /*
   */
//---------------------------------------------------------------------
int start()
{
   int Nmax;
   if(first==true)
   {
      Nmax=NUnits;
      if(Nmax>20) Nmax=20;
      if(Nmax<5) Nmax=5;
      if(SeniorTF<Period()) SeniorTF=Period();
      first=false;
   }
   else Nmax=4;
   for(int k=0;k<21;k++)
   {
      NumBars[k]=0;
      UpAndDn[k]=0;
   }
   for(int i=0;i<=Nmax;i++)
   {
    NumBars[i]=iCustom(Symbol(),SeniorTF,"SZZ_without_ZZ",Time[0],Nmax+1,0,i);
    UpAndDn[i]=iCustom(Symbol(),SeniorTF,"SZZ_without_ZZ",Time[0],Nmax+1,1,i);
   }
   if(NDel>0) for(i=0;i<=NDel;i++) { SnakeZZ[i]=0; ZZRubberString[i]=0; }
   int j;
   int n;
   int n2;
   int nu=0;
   while(nu<Nmax)
   {
      nu++;
      i=NumBars[nu];
      n=iBarShift(Symbol(),Period(),iTime(Symbol(),SeniorTF,i-1))+1;
      n2=iBarShift(Symbol(),Period(),iTime(Symbol(),SeniorTF,i));
      if(UpAndDn[nu]>0)
      {
         k=iHighest(Symbol(),Period(),MODE_HIGH,n2-n+1,n);
         SnakeZZ[k]=High[k];
         ZZRubberString[k]=SnakeZZ[k];
      }
      else
      {
         k=iLowest(Symbol(),Period(),MODE_LOW,n2-n+1,n);
         SnakeZZ[k]=Low[k];
         ZZRubberString[k]=SnakeZZ[k];
      }
      if(nu==1)
      {
         if(UpAndDn[0]>0)
         {
           j=iHighest(Symbol(),Period(),MODE_HIGH,k,0);
           SnakeZZ[0]=High[j];
           ZZRubberString[j]=High[j];
           if(j!=0)
           ZZRubberString[0]=Low[iLowest(Symbol(),Period(),MODE_LOW,j,0)];
           else ZZRubberString[0]=High[0];
         }
         else
         {
           j=iLowest(Symbol(),Period(),MODE_LOW,k,0);
           SnakeZZ[0]=Low[j];
           ZZRubberString[j]=Low[j];
           if(j!=0)
           ZZRubberString[0]=High[iHighest(Symbol(),Period(),MODE_HIGH,j,0)];
           else ZZRubberString[0]=Low[0];
         }
      }
      if(nu==3) j=k;
   }
   NDel=j;
   /*
   */
   return(0);
}
//---------------------------------------------------------------------
Comments