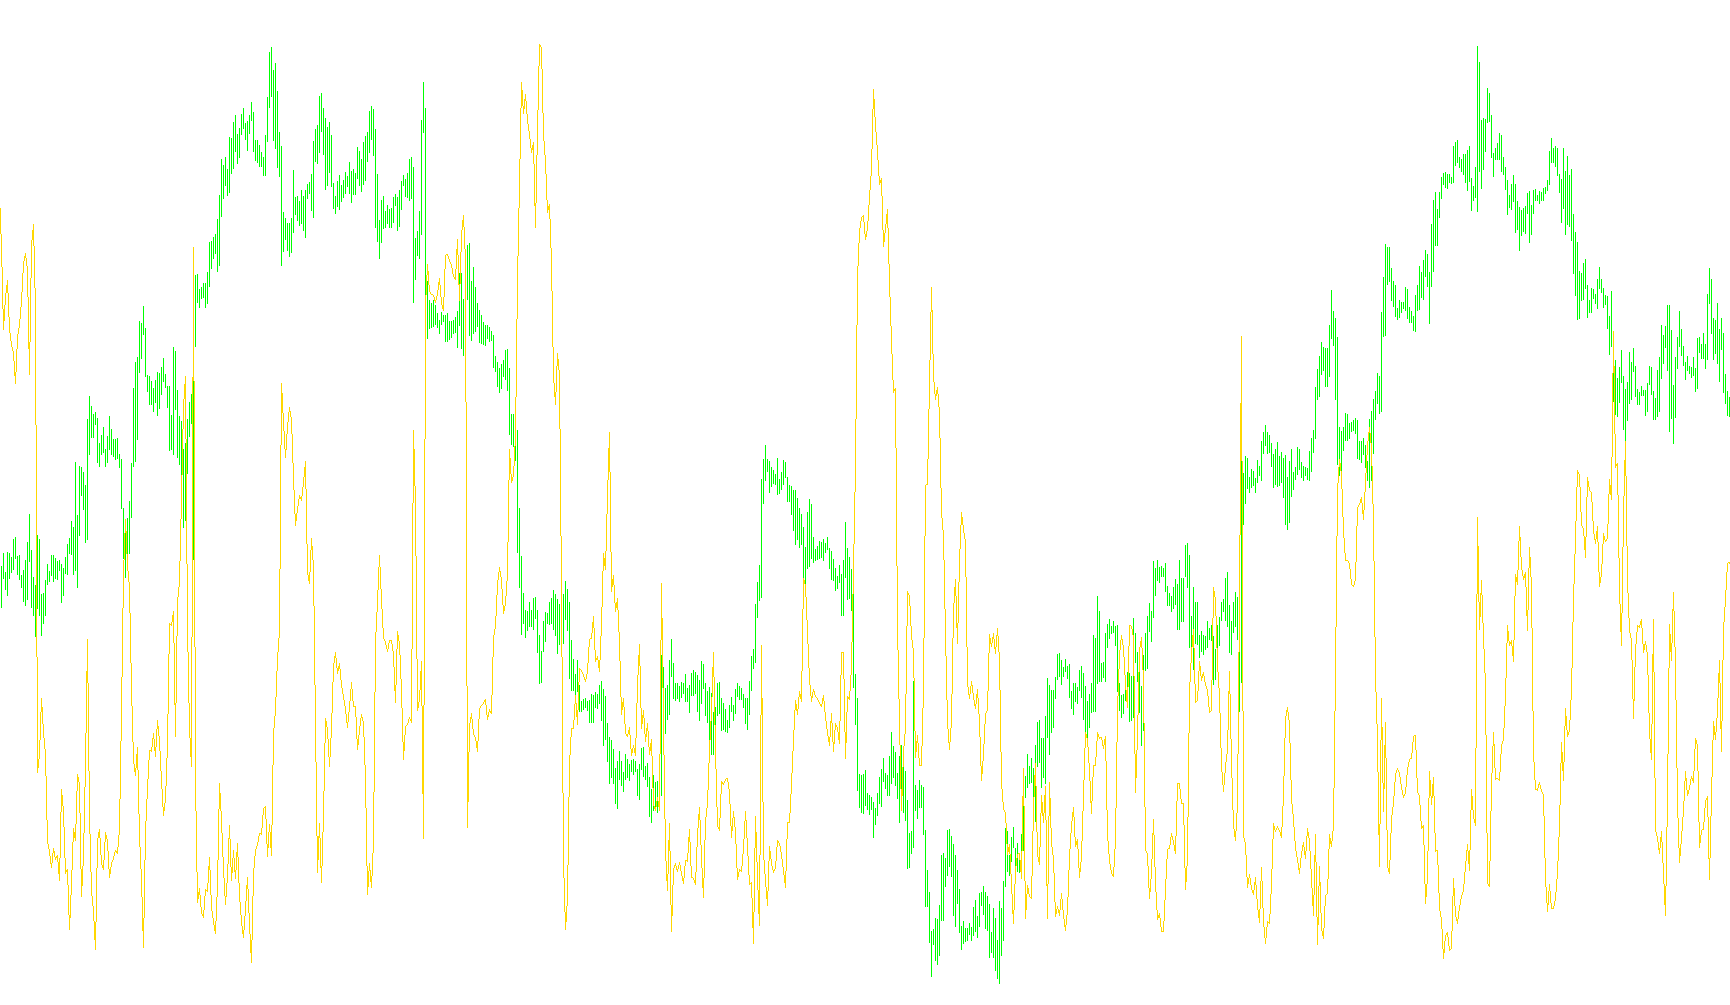
This tool is a specialized financial indicator designed to help traders visualize market volatility and potential turning points by creating a "synthetic" version of the VIX (Volatility Index). Because it generates its own data based on price action rather than relying on external market feeds, it serves as a practical way to gauge the "fear" or "intensity" within a specific asset.
How the Logic Works
The core objective of this script is to identify periods of extreme price movement relative to the recent historical average. It accomplishes this through a three-step logical process:
1. Identifying Recent Peaks The tool looks back at a specific window of time (defined by a user-set period, such as 22 bars). Within this window, it scans for the highest closing price reached. By focusing on the "high" of this recent history, the indicator establishes a benchmark for what the market considers a significant peak or resistance level during that timeframe.
2. Measuring Price Displacement Once the historical high is identified, the tool compares it to the current low price. It calculates the distance between these two points—essentially measuring how far the price has "dropped" or stretched away from its recent highs.
3. Converting Movement into a Volatility Score The final calculation converts this distance into a percentage. By dividing the difference between the high and the current low by the high value, the tool creates a relative score. This percentage represents the intensity of the price swing.
How to Interpret the Results
The result is plotted as a line in a separate window below your main trading chart.
- Low Values: When the line is steady or low, it suggests that the price is moving smoothly and there is relatively little "stress" or erratic movement in the market.
- High Spikes: When the line shoots upward rapidly, it indicates a significant percentage of price movement over a short period. These spikes often highlight areas of exhaustion or high volatility, which many traders use to identify potential trend reversals or moments of intense market emotion.
In summary, this script distills complex price history into a single visual stream, allowing you to see at a glance whether the market is behaving calmly or experiencing high-intensity fluctuations.
//+------------------------------------------------------------------+
//|                                                     Faux_VIX.mq4 |
//|                            Copyright © 2007, Matthew Ebersviller |
//|                                                                  |
//+------------------------------------------------------------------+

/**********************************************************************
* This is a Synthetic VIX indicator as described in the December 2007 *
* issue of "Active Trader" magazine.  The indicator is also named the *
* "Williams VIX Fix" since Larry Williams is credited with the        *
* formula's discovery.                                                *
*                                                                     *
* This indicator was coded by Matthew Ebersviller.                    *
**********************************************************************/


#property copyright "Copyright © 2007, Matthew Ebersviller"
#property link      ""

#property indicator_separate_window
#property indicator_buffers 1
#property indicator_color1 DodgerBlue
#property indicator_width1 1

extern int VIX_Period = 22;

double VixBuffer[];


int init() {
   string short_name;
   IndicatorBuffers(1);
   SetIndexStyle(0,DRAW_LINE);
   SetIndexBuffer(0,VixBuffer);
   //SetIndexBuffer(1,TempBuffer);
   short_name="VIX("+VIX_Period+")";
   IndicatorShortName(short_name);
   SetIndexLabel(0,short_name);

   SetIndexDrawBegin(0,VIX_Period);

   return(0);
}

int deinit()
  {
   return(0);
  }

int start()
  {
   int i, counted_bars=IndicatorCounted();

   if(Bars<=VIX_Period) return(0);

   if(counted_bars<1) {
      for(i=1;i<=VIX_Period;i++) {
         VixBuffer[Bars-i]=0.0;
      }
   }

   int limit=Bars-counted_bars;
   if (counted_bars>0) limit++;
   for(i=0; i<limit; i++)
      VixBuffer[i]=VIX(i);

   return(0);
  }
//+------------------------------------------------------------------+

double VIX(int shift) {
  double highClose, vix;
  highClose = High[iHighest(NULL,0,MODE_CLOSE,VIX_Period,shift)];
  vix = (highClose - Low[shift]) / highClose * 100;
  return (vix);
}
Comments