HMA_Color_nrp_
Download script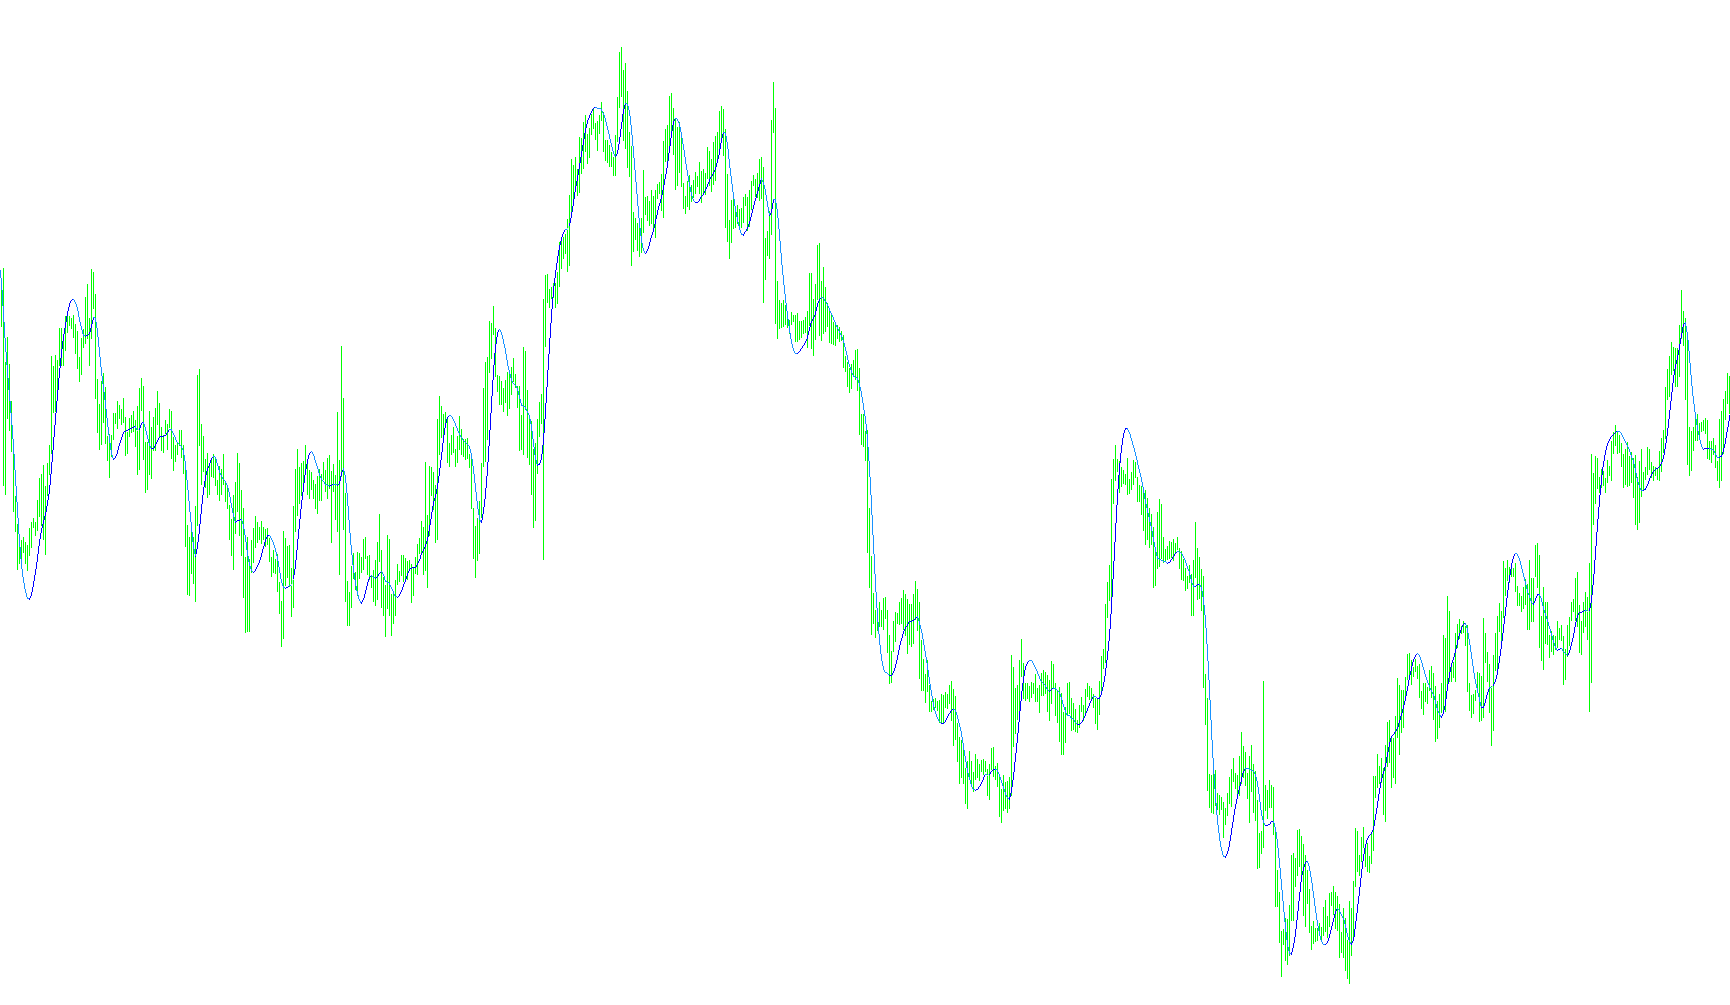
This tool is a specialized technical analysis indicator designed to provide traders with a visual representation of price trends by utilizing a "Hull Moving Average" (HMA). Its primary objective is to smooth out market noise while remaining highly responsive to recent price movements, allowing for a clearer view of the prevailing momentum.
Core Functionality
The script calculates a sophisticated moving average that combines different mathematical methods—specifically linear weighted averages—to reduce the typical "lag" found in standard indicators. By processing the data in multiple stages, it creates a fluid line that follows price action closely without being overly erratic.
Visual Logic and Trend Identification
What distinguishes this specific version from a standard moving average is its dynamic coloring and visual logic:
- Trend Detection: The script constantly monitors the direction of the moving average. If the line moves upward, it signals a bullish trend; if it moves downward, it signals a bearish trend.
- Dynamic Coloring: To make these shifts immediately obvious to the user, the indicator automatically changes color based on momentum. It utilizes different colors (such as Green for upward movements and Red for downward movements) to highlight active trends.
- Continuous Flow: The logic includes a specialized "Plotting" and "Cleaning" mechanism. This ensures that the lines appear as continuous, unbroken segments. It prevents visual gaps or overlapping colors, ensuring that when the trend changes, the transition is clean and distinct on your chart.
- Customizability: Users can adjust the "Period" to determine how much historical data the indicator should consider. A shorter period makes the indicator react faster to sudden price spikes, while a longer period provides a smoother, more generalized view of the market.
Summary for the User
In practical terms, this script serves as a visual guide for market direction. Instead of looking at a static line, you are looking at a reactive trend-follower that changes color the moment momentum shifts. It is designed to help traders quickly identify whether the current market environment is favoring an upward or downward move, simplifying the process of reading complex price charts.
//+------------------------------------------------------------------+
//|                                                HMA color nrp.mq4 |
//+------------------------------------------------------------------+
#property copyright "mladen"
#property link ""

#property indicator_chart_window
#property indicator_buffers 5
#property indicator_color1 Yellow
#property indicator_color2 Green
#property indicator_color3 Green
#property indicator_color4 Red
#property indicator_color5 Red
#property indicator_width1 2
#property indicator_width2 2
#property indicator_width3 2
#property indicator_width4 2
#property indicator_width5 2

//
//
//
//
//

extern int HMA_Period   = 20;
extern int HMA_PriceType = 0;
extern int VerticalShift = 0;
int    digits;

//
//
//
//
//

double ind_buffer0[];
double ind_buffer1[];
double ind_buffer2[];
double ind_buffer3[];
double ind_buffer4[];
double buffer[];


//+------------------------------------------------------------------
//|                                                                 |
//+------------------------------------------------------------------

int init()
{
   digits = MarketInfo(Symbol(),MODE_DIGITS)+1;

   //
   //
   //
   //
   //

   IndicatorShortName("HMA("+HMA_Period+")");
   IndicatorDigits(digits);
   IndicatorBuffers(6);
   SetIndexBuffer(0,ind_buffer0);
   SetIndexBuffer(1,ind_buffer1);
   SetIndexBuffer(2,ind_buffer2);
   SetIndexBuffer(3,ind_buffer3);
   SetIndexBuffer(4,ind_buffer4);
   SetIndexBuffer(5,buffer);

   int draw_begin=HMA_Period+MathFloor(MathSqrt(HMA_Period));
   for (int i = 0; i < indicator_buffers; i++)
   {
         SetIndexDrawBegin(i,draw_begin);
         SetIndexLabel(i,"Hull Moving Average");
   }
   return(0);
}


//+------------------------------------------------------------------+
//|                                                                  |
//+------------------------------------------------------------------+

int start()
{
   int HalfPeriod   = MathFloor(HMA_Period/2);
   int HullPeriod   = MathFloor(MathSqrt(HMA_Period));
   int counted_bars = IndicatorCounted();
   int limit,i;


   if(counted_bars<0) return(-1);
   if(counted_bars>0) counted_bars--;
      limit=Bars-counted_bars;


   //
   //
   //
   //
   //

   if (ind_buffer0[limit] > ind_buffer0[limit+1]) CleanPoint(limit,ind_buffer1,ind_buffer2);
   if (ind_buffer0[limit] < ind_buffer0[limit+1]) CleanPoint(limit,ind_buffer3,ind_buffer4);

   //
   //
   //
   //
   //

   for(i=limit; i>=0; i--)
         buffer[i]=iMA(NULL,0,HalfPeriod,0,MODE_LWMA,HMA_PriceType,i)*2-
                   iMA(NULL,0,HMA_Period,0,MODE_LWMA,HMA_PriceType,i);
   for(i=limit; i>=0; i--)
   {
      ind_buffer0[i] = NormalizeDouble(iMAOnArray(buffer,0,HullPeriod,0,MODE_LWMA,i),digits)+VerticalShift*Point;
      ind_buffer1[i] = EMPTY_VALUE;
      ind_buffer2[i] = EMPTY_VALUE;
      ind_buffer3[i] = EMPTY_VALUE;
      ind_buffer4[i] = EMPTY_VALUE;

      //
      //
      //
      //
      //

      if (ind_buffer0[i] > ind_buffer0[i+1]) PlotPoint(i,ind_buffer1,ind_buffer2,ind_buffer0);
      if (ind_buffer0[i] < ind_buffer0[i+1]) PlotPoint(i,ind_buffer3,ind_buffer4,ind_buffer0);
   }
   return(0);
}


//+------------------------------------------------------------------+
//|                                                                  |
//+------------------------------------------------------------------+
//
//
//
//
//

void CleanPoint(int i,double& first[],double& second[])
{
   if ((second[i]  != EMPTY_VALUE) && (second[i+1] != EMPTY_VALUE))
        second[i+1] = EMPTY_VALUE;
   else
      if ((first[i] != EMPTY_VALUE) && (first[i+1] != EMPTY_VALUE) && (first[i+2] == EMPTY_VALUE))
          first[i+1] = EMPTY_VALUE;
}

//
//
//
//
//

void PlotPoint(int i,double& first[],double& second[],double& from[])
{
   if (first[i+1] == EMPTY_VALUE)
      {
      if (first[i+2] == EMPTY_VALUE) {
          first[i]    = from[i];
          first[i+1]  = from[i+1];
          second[i]   = EMPTY_VALUE;
         }
      else {
          second[i]   = from[i];
          second[i+1] = from[i+1];
          first[i]    = EMPTY_VALUE;
         }
      }
   else
      {
         first[i]   = from[i];
         second[i]  = EMPTY_VALUE;
      }
}
Comments