StochHistogram
Download script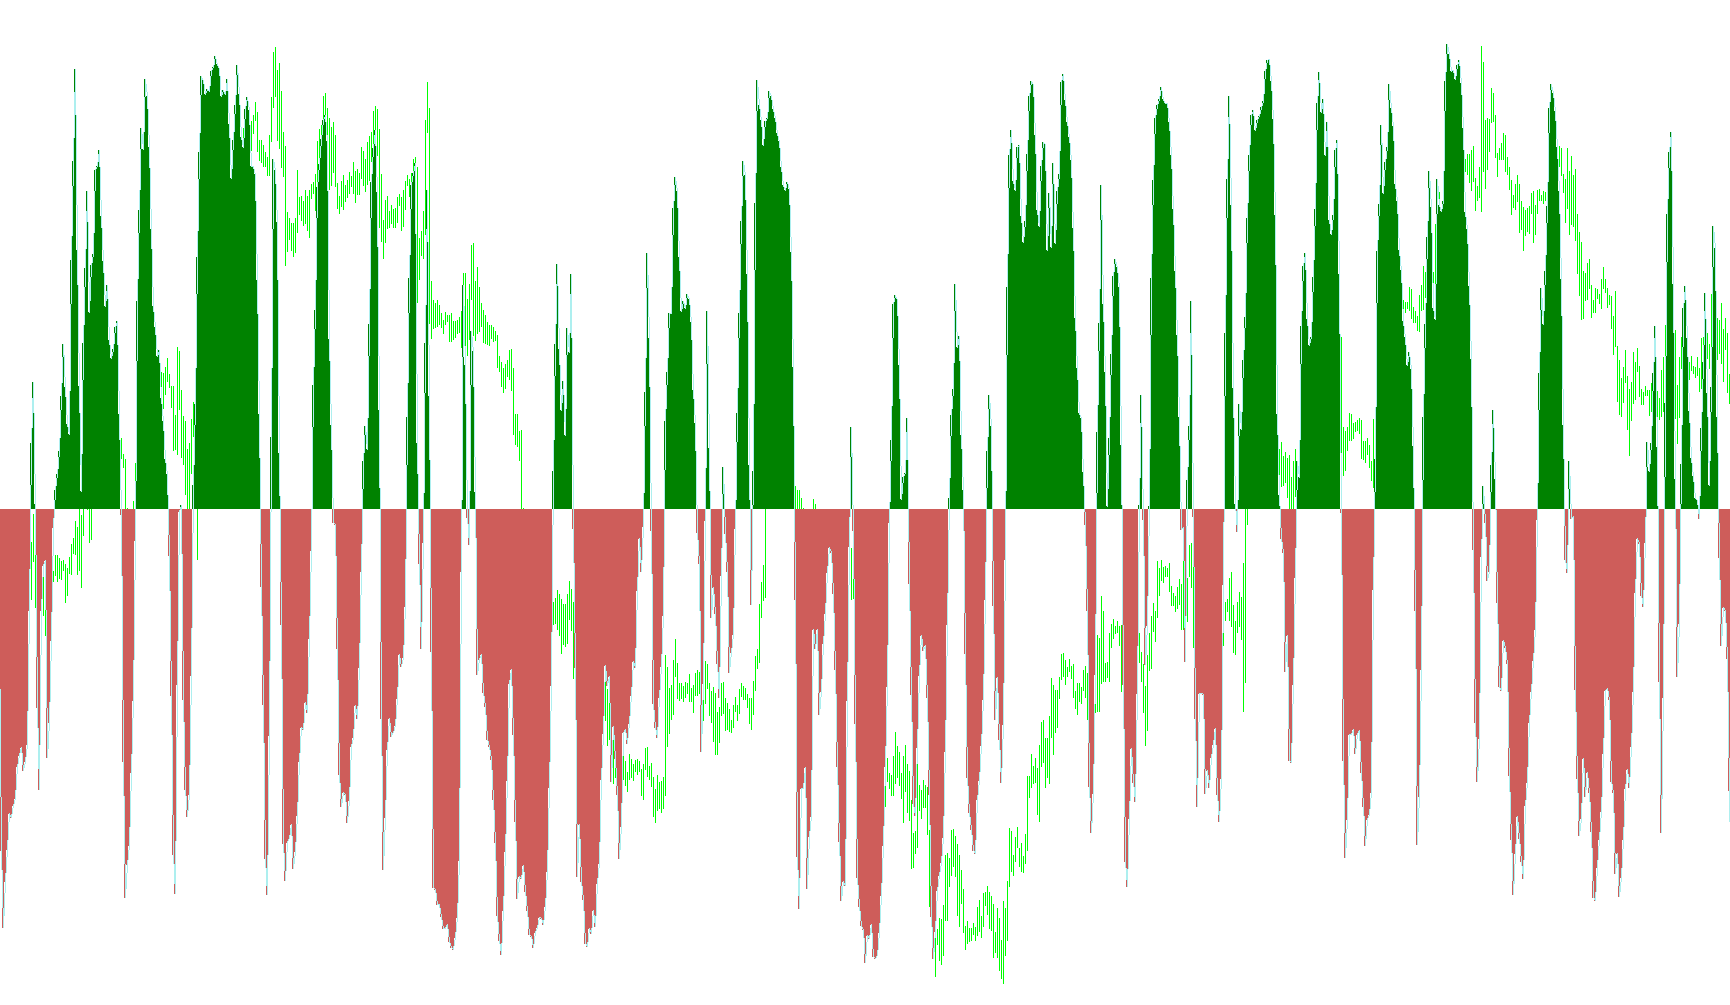
Overview of the Bollinger Squeeze v8 Logic
This technical indicator is designed to provide traders with a visual representation of market momentum and trend direction by analyzing price movements through a specialized lens. Instead of looking at standard price action alone, it transforms raw data into a "histogram" format that highlights the strength and polarity of current market cycles.
Core Methodology
The logic relies on a modified version of the Stochastic Oscillator. Typically, this type of oscillator measures where the current price sits relative to its price range over a specific period. In this script, the indicator takes that standard calculation and applies a mathematical "offset."
By subtracting a baseline value (50) from the standard Stochastic line, the tool centers the data around a zero point. This allows the indicator to clearly distinguish between positive momentum (moving upward) and negative momentum (moving downward).
Visual Logic and Interpretation
The indicator populates a separate window on your chart using three distinct visual components:
- The Bullish Trend (Green Histogram): When the calculated momentum is above the zero line, the script generates a green histogram. This signals that the market currently has positive momentum, suggesting an upward trend or buying pressure.
- The Bearish Trend (Red Histogram): When the calculated momentum falls below the zero line, the script generates a red histogram. This indicates negative momentum, suggesting a downward trend or selling pressure.
- The Momentum Line: A continuous line tracks the raw movement of the Stochastic values. This provides a secondary layer of detail, showing how quickly the momentum is accelerating or decelerating relative to the histograms.
Practical Application
For a user navigating the charts, this logic serves as a filter for market "mood." Rather than just seeing a price point, you can see the underlying strength of a move. When the histogram stays firmly in one color, it confirms the persistence of a trend. When the histogram shifts colors or crosses the zero line, it alerts the user to a potential shift in market sentiment from one direction to another.
/*
*********************************************************************

                      Bollinger Squeeze v8
                  Original code by Nick Bilak
                   Modifications by Akuma99
                   Copyright © 2006-07  Akuma99
                  http://www.beginnertrader.com

       For help on this indicator, tutorials and information
               visit http://www.beginnertrader.com

*********************************************************************
*/

#property copyright "Copyright © 2006-07, Akuma99"
#property link      "http://www.beginnertrader.com "

#property indicator_separate_window
#property indicator_buffers 3
#property indicator_color1 Green //uptrend
#property indicator_width1 2
#property indicator_color2 IndianRed  //downtrend
#property indicator_width2 2
#property indicator_color3 DarkGreen // First Stochastic line
#property indicator_width3 2


extern string note1 = "First Stochastic";
extern int    StochPeriod1=14;
extern int    DPeriod1=3;
extern int    SlowingPeriod1=3;

double upB[];
double loB[];
double Stoch1[];
//+------------------------------------------------------------------+
int init() {

   IndicatorBuffers(3);

   SetIndexStyle(0,DRAW_HISTOGRAM,STYLE_SOLID,indicator_width1,indicator_color1);
   SetIndexBuffer(0,upB);
   SetIndexEmptyValue(0,EMPTY_VALUE);

   SetIndexStyle(1,DRAW_HISTOGRAM,STYLE_SOLID,indicator_width2,indicator_color2); //downtrend
   SetIndexBuffer(1,loB);
   SetIndexEmptyValue(1,EMPTY_VALUE);

   SetIndexStyle(2,DRAW_LINE);
   SetIndexBuffer(2,Stoch1);
   return(0);
}
//+------------------------------------------------------------------+
int deinit() {


}
//+------------------------------------------------------------------+
int start() {

   int counted_bars=IndicatorCounted();
   int shift,limit;

   IndicatorShortName("Stoch Histogram ("+StochPeriod1+","+DPeriod1+","+SlowingPeriod1+")");
   if (counted_bars<0) return(-1);
   if (counted_bars>0) counted_bars--;

   limit=Bars-31;
   if(counted_bars>=31) limit=Bars-counted_bars-1;

   for (shift=limit;shift>=0;shift--)   {

      Stoch1[shift]=iStochastic(NULL,0,StochPeriod1,DPeriod1,SlowingPeriod1,MODE_SMA,0,MODE_MAIN,shift)-50;

      if(Stoch1[shift]>0) {

         upB[shift]=Stoch1[shift];

      } else if (Stoch1[shift]<0){

         loB[shift]=Stoch1[shift];

      }
   }

   return(0);

}
//+------------------------------------------------------------------+
Comments