Stoch_Strike(AM)_SW
Download script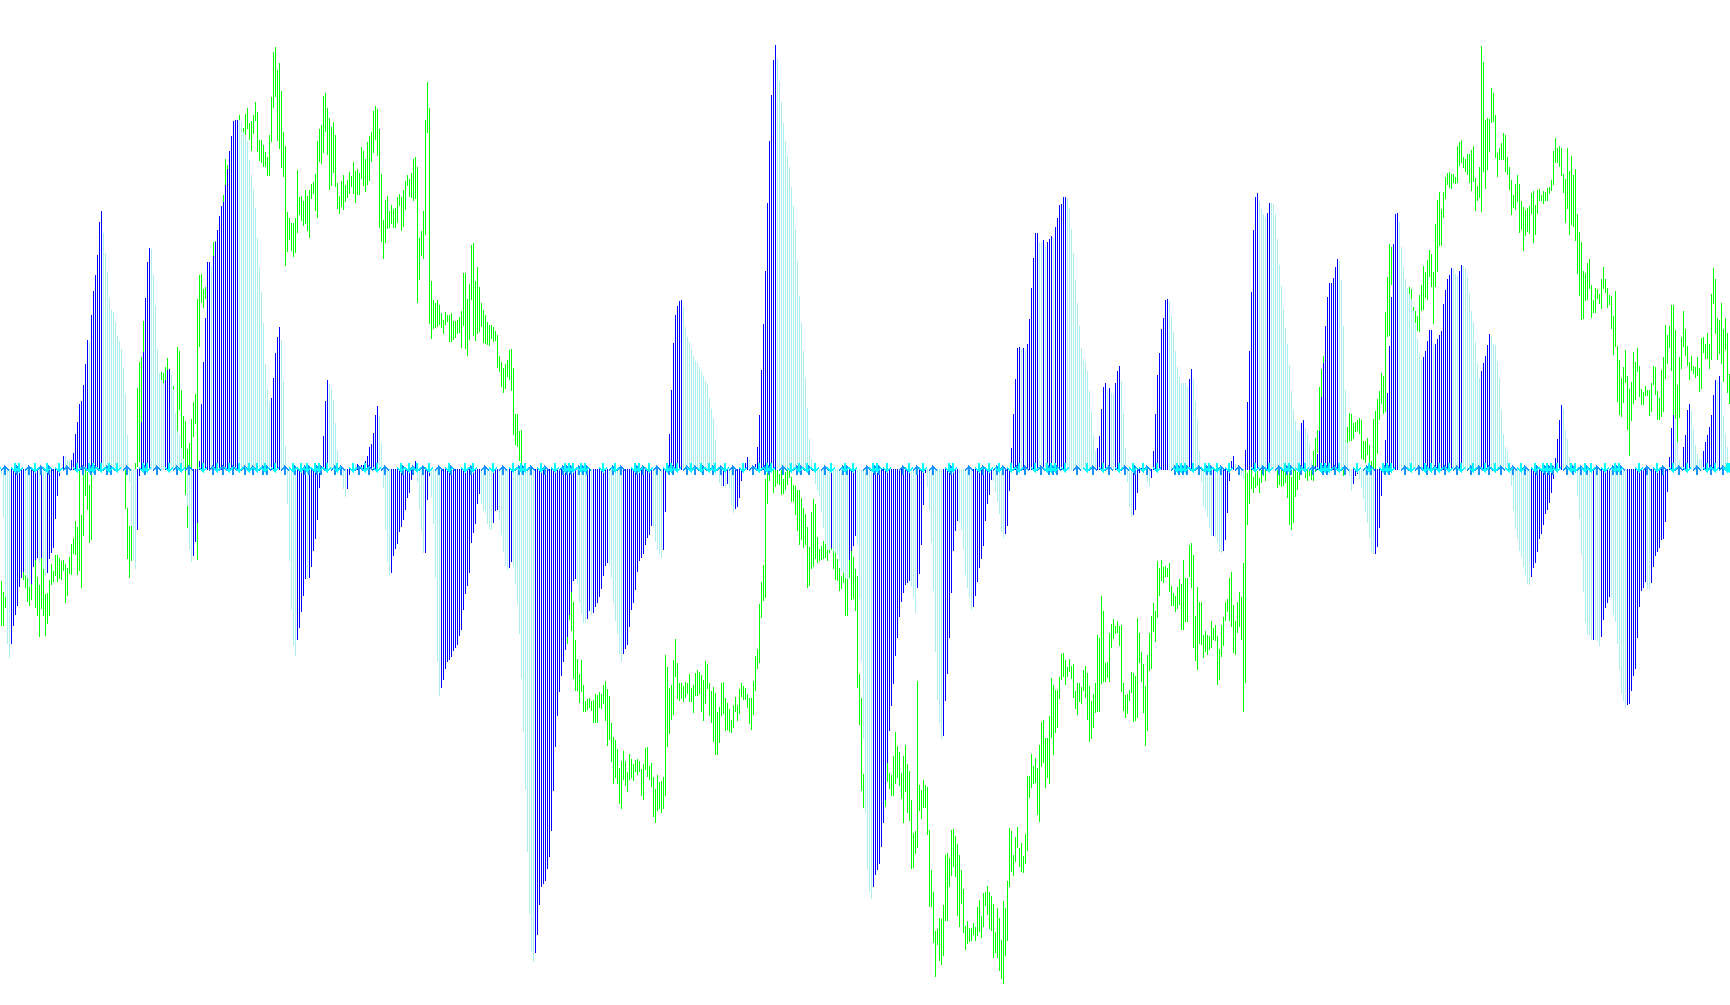
This custom indicator for MetaTrader 4 is designed to provide traders with a visual summary of market momentum by combining two distinct types of technical analysis: Moving Average crossovers and Stochastic oscillations. It creates a multi-layered visual environment in a separate window below your main price chart to help identify potential trend shifts and entry points.
Core Components of the Logic
1. The Momentum Histogram (MACD-style logic) The tool begins by calculating the difference between two Moving Averages (a "fast" one and a "slow" one). By subtracting the value of the slower moving average from the faster one, the script determines the current strength of the price movement.
- Trend Identification: When the result is positive, it indicates upward pressure; when negative, it indicates downward pressure.
- Visual Representation: Instead of showing a simple line, the logic categorizes these results into two specific histograms (labeled as MACD+ and MACD-).
2. Trend Directional Filtering The script doesn't just plot the momentum; it analyzes the "slope" of that momentum from one bar to the next. It checks if the current momentum value is rising or falling compared to the previous bar:
- If the momentum is currently decreasing, the indicator highlights the positive momentum histogram.
- If the momentum is currently increasing, it highlights the negative momentum histogram. This creates a visual distinction between a trend that is gaining strength and one that is losing steam.
3. The "Stochastic Strike" Signals In addition to the histograms, the script monitors a Stochastic Oscillator. This oscillator measures whether the price is overbought or oversold relative to its recent range. The script looks specifically for "crossovers"—moments where the oscillator line changes direction sharply:
- Buy/Sell Triggers: The logic identifies specific points where the current value of the stochastic oscillator crosses a previous point in a way that suggests a reversal.
- Visual Cues: These signals are marked on your chart as arrows (Stoch Strike+ and Stoch Strike-), providing clear, actionable markers for where the script detects a potential pivot in the market.
Summary for the Trader
Think of this tool as a two-step filter. First, the Histograms provide a broad view of the "current weather"—showing you which way the wind is blowing and how strong it is. Second, the Stochastic Strikes (Arrows) act as your "warning lights," signaling specific moments when that wind might be about to change direction, allowing for more precise timing on your trades.
//+------------------------------------------------------------------+
//|                                          Stoch_Strike(AM)_SW.mq4 |
//|                                               Andrey Matvievskiy |
//|                                                                  |
//+------------------------------------------------------------------+
#property copyright "Andrey Matvievskiy"
#property link      ""

#property indicator_separate_window

#property indicator_buffers 5

#property indicator_color1 Black
#property indicator_color2 Green
#property indicator_color3 Red
#property indicator_color4 Green
#property indicator_color5 Red


//---- input parameters
extern int Period_MA1 = 34;
extern int Period_MA2 = 5;
extern int Price_MA1 = 4;
extern int Price_MA2 = 4;
extern int Method_MA1 = 0;
extern int Method_MA2 = 0;

extern int KPeriod=5;
extern int Slowing=3;
extern int MA_Method = 0; // SMA 0, EMA 1, SMMA 2, LWMA 3
extern int PriceField = 0; // Low/High 0, Close/Close 1

extern int TF=0;

double ExtBuffer0[] ;
double ExtBuffer1[] ;
double ExtBuffer2[] ;

double CrossUp1[];
double CrossDown1[];

//+------------------------------------------------------------------+
//| Custom indicator initialization function                         |
//+------------------------------------------------------------------+
int init()
  {
   SetIndexStyle(0,DRAW_NONE);
   SetIndexBuffer(0, ExtBuffer0);

   SetIndexStyle(1,DRAW_HISTOGRAM,0,1);
   SetIndexBuffer(1,ExtBuffer1);
   SetIndexStyle(2,DRAW_HISTOGRAM,0,1);
   SetIndexBuffer(2,ExtBuffer2);

   SetIndexStyle(3, DRAW_ARROW,0,0);
   SetIndexArrow(3, 233);
   SetIndexBuffer(3, CrossUp1);
   SetIndexStyle(4, DRAW_ARROW,0,0);
   SetIndexArrow(4, 234);
   SetIndexBuffer(4, CrossDown1);

   SetIndexLabel(0,NULL);
   SetIndexLabel(1,"MACD+");
   SetIndexLabel(2,"MACD-");
   SetIndexLabel(3,"Stoch Strike+");
   SetIndexLabel(4,"Stoch Strike-");

   IndicatorShortName("Stoch_Strike(AM)_SW (TF "+TF+")");
   return(0);
  }
//+------------------------------------------------------------------+
//| Custom indicator deinitialization function                       |
//+------------------------------------------------------------------+
int deinit()
  {
//----

//----
   return(0);
  }
//+------------------------------------------------------------------+
//| Custom indicator iteration function                              |
//+------------------------------------------------------------------+

   int start()
  {
   int    limit;
   int    counted_bars=IndicatorCounted();
   double prev1,current1;
   if(counted_bars>0) counted_bars--;
   limit=Bars-counted_bars;
      for(int i=0; i<limit; i++)
      ExtBuffer0[i]=iMA(NULL,TF,Period_MA2,0,Method_MA2,Price_MA2,i)-iMA(NULL,TF,Period_MA1,0,Method_MA1,Price_MA1,i);
      bool up1=true;
      for(i=limit-1; i>=0; i--)
     {
      current1=ExtBuffer0[i];
      prev1=ExtBuffer0[i+1];
      if(current1>prev1) up1=true;
      if(current1<prev1) up1=false;
      if(!up1)
        {
         ExtBuffer2[i]=current1;
         ExtBuffer1[i]=0.0;
        }
      else
        {
         ExtBuffer1[i]=current1;
         ExtBuffer2[i]=0.0;
        }


      double X = iStochastic(NULL, TF, KPeriod, 3, Slowing,MA_Method, PriceField, MODE_MAIN, i);
      double Y = iStochastic(NULL, TF, KPeriod, 3, Slowing,MA_Method, PriceField, MODE_MAIN, i+1);
      double Z = iStochastic(NULL, TF, KPeriod, 3, Slowing,MA_Method, PriceField, MODE_MAIN, i+2);

        if  ((Y<X) && (Z>Y))
        {
         CrossUp1[i]=0;
        }
        else  if ((Y>X) && (Z<Y))
        {
         CrossDown1[i]=0;
        }
  }

//----
   return(0);
  }
//+------------------------------------------------------------------+
Comments