SilverTrend_v2
Download script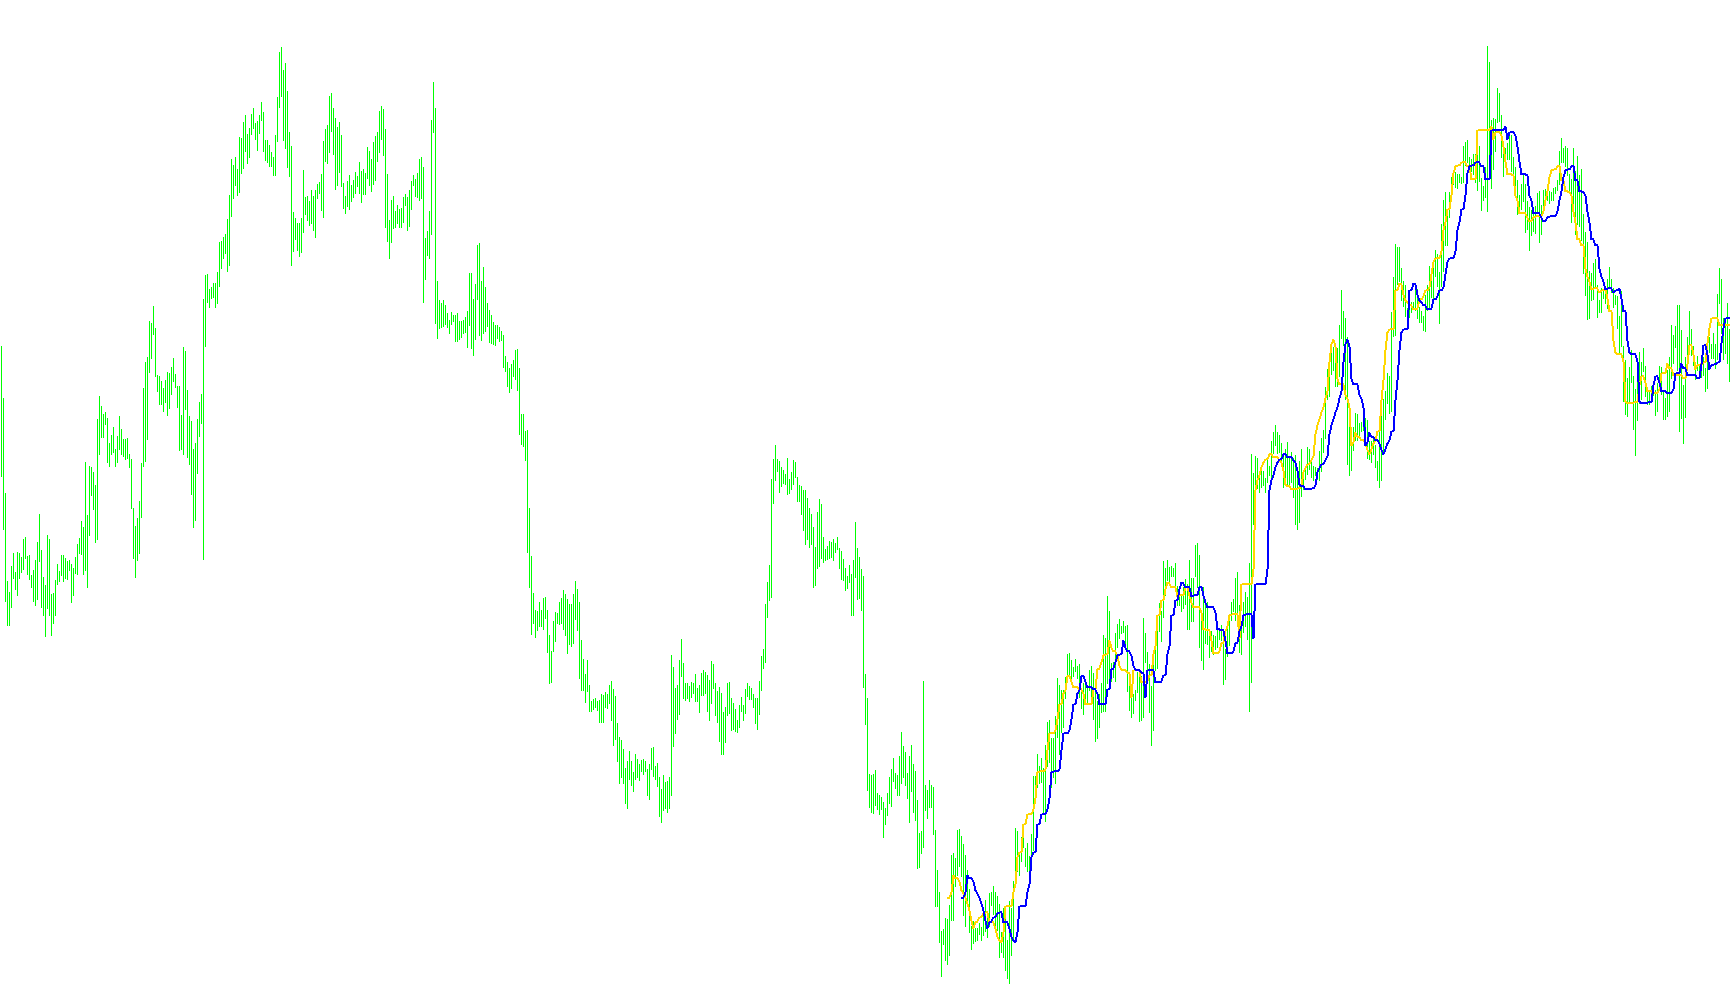
This tool is designed to analyze price trends on a trading chart by identifying specific boundaries and momentum shifts in market movement. It focuses on visualizing the relationship between high and low price points over a rolling period of recent data.
Core Logic Overview
The script scans the history of the market to identify the highest and lowest prices reached within a user-defined window (the "Lookback Period"). Based on these extremes, it calculates two specific dynamic levels:
- Upper Boundaries: Derived from the highest price points, adjusted by a percentage-based sensitivity.
- Lower Boundaries: Derived from the lowest price points, similarly adjusted to reflect market volatility.
By calculating these boundaries, the script creates a visual representation of the market's "trading range." It essentially maps out the ceiling and floor of the current price action.
Signal Generation
The primary purpose of this logic is to detect a crossover or a shift between these calculated levels. The script monitors whether the current price action is trending toward an expansion or contraction based on how the upper and lower boundaries interact:
- Buy Signals: Triggered when the current calculation indicates a bullish move or a break in the downward trend. When this occurs, the tool provides an immediate visual comment on the chart and triggers an audible alert.
- Sell Signals: Triggered when the price action suggests a bearish turn or a reversal from an upward trend. Like the buy signals, these are accompanied by chart comments and audio notifications.
Key Features for Users
- Visual Feedback: The tool draws lines on your chart to help you see where these significant trend levels are currently forming.
- Smart Alerting: To prevent constant noise, the system includes a "one-time" alert logic. This ensures that once a buy or sell signal is triggered, you are notified immediately, and the tool waits for a confirmed opposite signal before notifying you again.
- Customizable Sensitivity: Users can adjust parameters to control how many bars of history the script considers and how aggressively it reacts to price fluctuations (via the K-values), allowing the tool to be tuned for different styles of trading—from fast-paced scalping to slower, long-term trend following.
//+------------------------------------------------------------------+
//|              Filename changed to ForexOFFTrend.mq4 by CrazyChart |
//|                                                 SilverTrend .mq4 |
//|                              SilverTrend rewritten by CrazyChart |
//|                                                  http://viac.ru/ |
//+------------------------------------------------------------------+

#property copyright "SilverTrend rewritten by CrazyChart"
#property link "http://viac.ru/ "
//----
#property indicator_chart_window
#property indicator_buffers 2
#property indicator_color1 Blue
#property indicator_color2 Red
//---- input parameters
extern int CountBars = 400;
extern int SSP = 7;
extern double Kmin = 1.6;
extern double Kmax = 50.6;
extern bool gAlert = True; // Switch to allow alerts
//---- buffers
double ExtMapBuffer1[];
double ExtMapBuffer2[];
//----
bool gSellAlertGiven = false; // Used to stop constant alerts
bool gBuyAlertGiven = false; // Used to stop constant alerts
//+------------------------------------------------------------------+
//| Custom indicator initialization function                         |
//+------------------------------------------------------------------+
int init()
  {
//---- indicators
   SetIndexStyle(0, DRAW_LINE, 0, 2);
   SetIndexBuffer(0, ExtMapBuffer1);
   SetIndexStyle(1, DRAW_LINE, 0, 2);
   SetIndexBuffer(1, ExtMapBuffer2);
//----
   if(CountBars >= Bars)
       CountBars = Bars;
   SetIndexDrawBegin(0, Bars - CountBars + SSP);
   SetIndexDrawBegin(1, Bars - CountBars + SSP);
//----
   return(0);
  }
//+------------------------------------------------------------------+
//| Custor indicator deinitialization function                       |
//+------------------------------------------------------------------+
int deinit()
  {
   return(0);
  }
//+------------------------------------------------------------------+
//| Custom indicator iteration function                              |
//+------------------------------------------------------------------+
int start()
  {
   int i,
   i2,
   loopbegin,
   counted_bars = IndicatorCounted();
   double SsMax,
   SsMin,
   K,
   val1,
   val2,
   smin,
   smax,
   price;
   if(Bars <= SSP + 1)
       return(0);
//---- initial zero
   if(counted_bars < SSP + 1)
     {
       for(i = 1; i <= SSP; i++)
           ExtMapBuffer1[CountBars-i] = 0.0;
       for(i = 1; i <= SSP; i++)
           ExtMapBuffer2[CountBars-i] = 0.0;
     }
   for(i = CountBars - SSP; i >= 0; i--)
     {
       SsMax = High[Highest(NULL, 0, MODE_HIGH, SSP, i - SSP + 1)];
       SsMin = Low[Lowest(NULL, 0, MODE_LOW, SSP, i - SSP + 1)];
       smin = NormalizeDouble((SsMin - (SsMax - SsMin)*Kmin / 100), Digits);
       smax = NormalizeDouble((SsMax - (SsMax - SsMin)*Kmax / 100), Digits);
       ExtMapBuffer1[i-SSP+6] = smax;
       ExtMapBuffer2[i-SSP-1] = smax;
       val1 = ExtMapBuffer1[0];
       val2 = ExtMapBuffer2[0];
       if(val1 > val2)
         {
           Comment(Symbol()+ " buy ", val1);
           if(gAlert == true && gBuyAlertGiven == false)
             {
               PlaySound("alert.wav");

               Alert(Symbol()+" Buy signal at " + DoubleToStr(val1, Digits) + " on " + Period() +
                     " minute chart");
               gBuyAlertGiven = true;
               gSellAlertGiven = false;
             }
         }
       if(val1 < val2)
         {
           Comment(Symbol()+ " sell ", val2);
           if(gAlert == true && gSellAlertGiven == false)
             {
               PlaySound("alert.wav");
               Alert(Symbol()+" Sell signal at " + DoubleToStr(val2, Digits) + " on " + Period()+
                     " minute chart");
               gBuyAlertGiven = false;
               gSellAlertGiven=true;
             }
         }
     }
//----
   return(0);
  }
//+------------------------------------------------------------------+
Comments