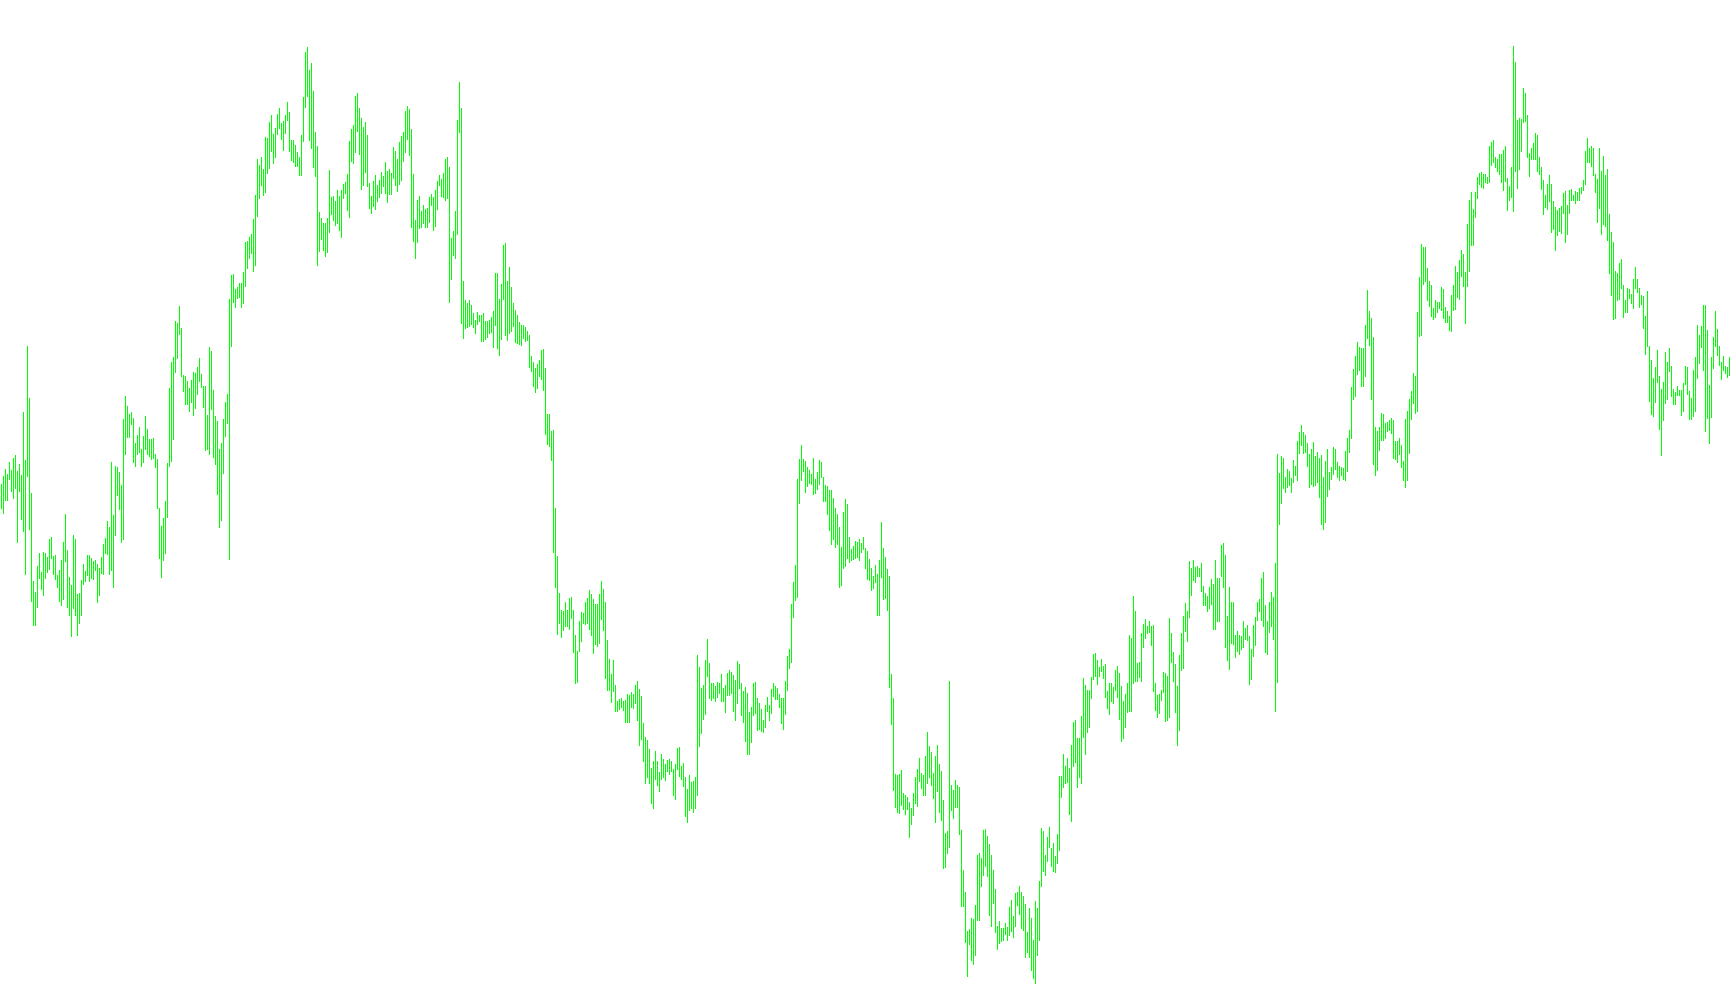
This specialized trading indicator is designed to analyze market momentum and price movement by calculating a specific type of smoothing oscillation. Instead of simply looking at raw price changes, the tool uses a sophisticated multi-layered mathematical approach to filter out "noise" and identify the underlying direction of the market trend.
How the Logic Works
The script functions in two primary stages: calculation and visual signaling.
1. Momentum Smoothing (Laguerre Calculation) The core of this indicator relies on a four-stage smoothing process. It takes current closing prices and blends them with previous data points using a user-defined sensitivity factor (Gamma). By linking four different layers of data together, the script creates a "weighted" momentum value. This allows the indicator to be more responsive than standard moving averages while remaining smooth enough to prevent erratic movements from triggering false signals.
2. The Oscillator Range The script then calculates the difference between these four smoothed layers. It identifies whether the price movement is gaining strength or losing steam by comparing these values against one another. This results in a normalized value (an oscillator) that helps traders see where the market sits in terms of current momentum relative to its recent history.
3. Visual Buy and Sell Signals Once the momentum value is calculated, the script compares the current value to the previous one to determine the direction of the trend:
- Buy Signals: When the momentum value increases compared to the previous point, the indicator identifies an upward trend and highlights this as a "Buy" signal on the chart.
- Sell Signals: When the momentum value decreases compared to the previous point, the indicator identifies a downward trend and highlights this as a "Sell" signal.
Summary for Traders
In practical terms, this tool acts as a momentum tracker. It ignores minor price fluctuations and focuses on significant shifts in market velocity. By visualizing these shifts as distinct "Buy" and "Sell" histograms, it provides a clear visual cue of when the trend is shifting upward or downward, helping traders identify potential entry points based on the strength of the current market move.
//+------------------------------------------------------------------+
//|                                  Áîëüøàÿ Êîëëåêöèÿ Ñåìàôîðîâ.mq4 |
//+------------------------------------------------------------------+
#property copyright "Ñåðãååâ Àëåêñåé (ñ) 2007"

#property indicator_separate_window
#property indicator_level2 0.75
#property indicator_level3 0.45
#property indicator_level4 0.15
#property indicator_buffers 3
#property indicator_color1 Red
#property indicator_color2 Crimson
#property indicator_color3 LimeGreen
#property indicator_width1 2
#property indicator_width2 2
#property indicator_width3 2
#property indicator_style1 STYLE_SOLID
#property indicator_style2 STYLE_SOLID
#property indicator_style3 STYLE_SOLID
//---- input parameters
extern double gamma=0.7;
extern int CountBars=10000;

double L0 = 0;
double L1 = 0;
double L2 = 0;
double L3 = 0;
double L0A = 0;
double L1A = 0;
double L2A = 0;
double L3A = 0;
double LRSI = 0;
double CU = 0;
double CD = 0;

double val[];
double Buy[];
double Sell[];

int init()
{
	SetIndexBuffer(0,val);SetIndexDrawBegin(0,Bars-CountBars);
	SetIndexStyle(1,DRAW_HISTOGRAM);	SetIndexBuffer(1,Sell);
	SetIndexStyle(2,DRAW_HISTOGRAM);	SetIndexBuffer(2,Buy);
	IndicatorShortName("Laguerre("+DoubleToStr(gamma,2)+")");
	return(0);
}

int deinit()  {   return(0);  }

int start()
{
	int i=CountBars-1;
	while(i>=0)
	{
		L0A = L0;
		L1A = L1;
		L2A = L2;
		L3A = L3;
		L0 = (1 - gamma)*Close[i] + gamma*L0A;
		L1 = - gamma *L0 + L0A + gamma *L1A;
		L2 = - gamma *L1 + L1A + gamma *L2A;
		L3 = - gamma *L2 + L2A + gamma *L3A;

		CU = 0;
		CD = 0;

		if (L0 >= L1) CU = L0 - L1; else CD = L1 - L0;
		if (L1 >= L2) CU = CU + L1 - L2; else CD = CD + L2 - L1;
		if (L2 >= L3) CU = CU + L2 - L3; else CD = CD + L3 - L2;

		if (CU + CD != 0) LRSI = CU / (CU + CD);
		val[i] = LRSI;
		i--;
	}
	bool b=false, s=false;
	for (i=CountBars-2; i>=0; i--)
	{
		Buy[i]=0.0; Sell[i]=0.0;
		if (val[i]<val[i+1]) { Sell[i] = val[i]; b=false; s=true; } //ïðîäàåì
		else
			if (val[i]>val[i+1]) { Buy[i] = val[i]; b=true; s=false;}//ïîêóïàåì
			else
			{
				if (b) Buy[i]=val[i];
				if (s) Sell[i]=val[i];
			}
	}

	return(0);
}
//+------------------------------------------------------------------+
Comments