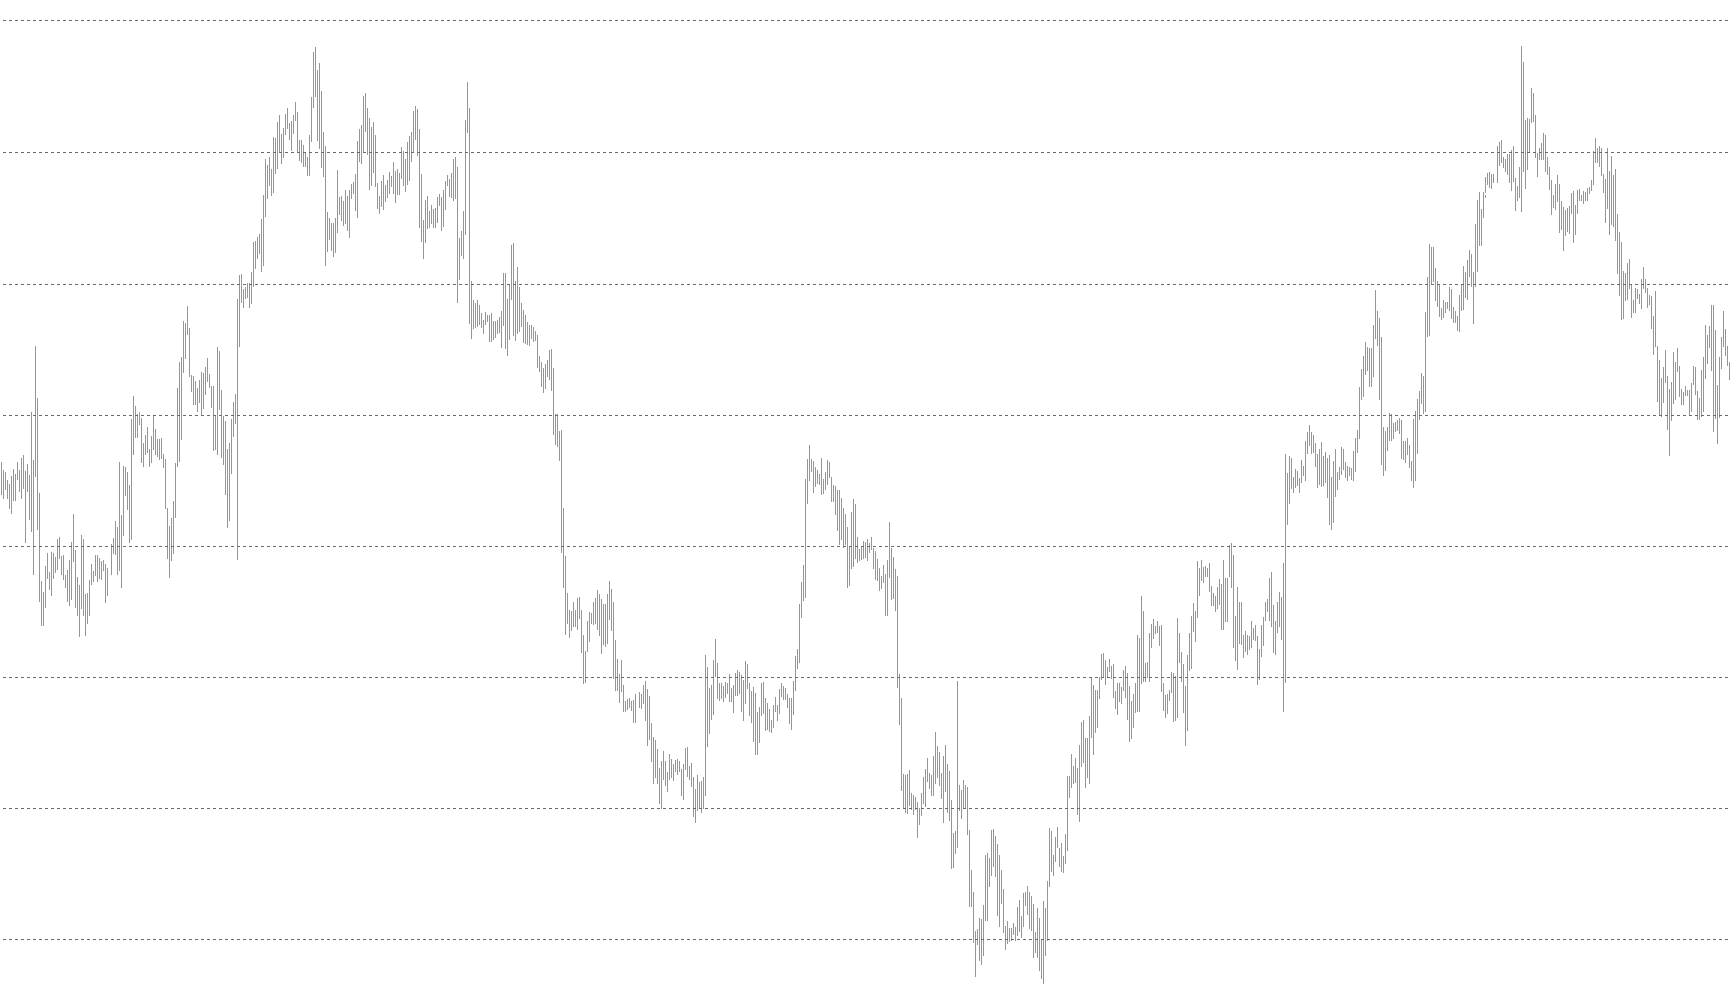
The 9Squared Gann tool is a specialized technical indicator designed to project potential price levels and time zones based on the principles of Gann Theory. Instead of relying on standard moving averages or typical momentum indicators, this script uses a geometric approach to map out significant "Support" and "Resistance" areas on your trading chart.
Core Logic and Functionality
The script operates by taking a specific starting price point provided by the user and projecting forward and backward mathematical cycles. Here is a breakdown of how the logic flows:
1. Price Point Identification The tool begins by scanning the historical data of your current chart to locate the specific price value you have entered into the settings. It identifies whether this value was touched as a high or a low, establishing a "base" for all subsequent calculations.
2. Geometric Cycle Calculation Once the base price is found, the script applies a unique mathematical formula influenced by two main factors:
- The Angle: A user-defined degree (defaulting to 9) that dictates the spread of the projected lines.
- Price Scaling: The script automatically detects the decimal precision of your specific currency pair (e.g., whether it has two or five digits) to ensure the calculations remain accurate across different symbols like Forex, Gold, or Indices.
3. Projection of Support and Resistance The heart of the script is its ability to generate a comprehensive map of potential price action:
- Resistance Levels: It projects 36 distinct levels above your base price. These represent areas where the market might encounter upward pressure or "ceilings."
- Support Levels: It simultaneously projects 36 levels below your base price, highlighting "floors" where price might find stability or bounce back up.
- Visual Organization: All these lines are automatically drawn on your chart with customizable colors and widths, allowing you to see a "grid" of significant price zones at a glance.
4. Fibonacci Time Cycles Beyond just horizontal price levels, the script includes an optional feature to visualize time-based cycles. If enabled, it draws Fibonacci-based time zones. This helps traders identify not just where the price might react, but also when those reactions are mathematically more likely to occur based on the distance from your starting price point.
Summary for the Trader
In simple terms, this tool transforms a single price point into a comprehensive roadmap of the market's geometry. By plotting 72 specific price levels (36 up, 36 down) and potential time zones, it provides a structured environment for traders to anticipate key structural shifts in price movement based on Gann’s theories of expansion and contraction.
//+------------------------------------------------------------------+
//|                                                9Squared Gann.mq4 |
//|                  Copyright © 2007, Steve Bowley, concept,formulas|
//|                                    & Patrick Nouvion, programming|
//|                       www.9squaredfx.com, www.patricknouvion.com |
//+------------------------------------------------------------------+
#property copyright "Copyright © 2007, Steve Bowley & Patrick Nouvion"
#property link      "www.9squaredfx.com, www.patricknouvion.com"

#property indicator_chart_window

extern double  Value = 1.1234;
extern double  Angle = 9;
extern int     Width = 1;
extern bool DisplayFiboCycles = True;
//---- Colors
extern string COLORS = "===========COLORS==========";
extern color    ResistanceColor = DimGray;
extern color       SupportColor = SteelBlue;
extern color FiboTimeZonesColor = Gray;

//+------------------------------------------------------------------+
//|                          INIT | DEINIT                           |
//+------------------------------------------------------------------+
int init()   { CleanUp(); return(0); }
int deinit() { CleanUp(); return(0); }
//+------------------------------------------------------------------+
//|                              GS9                                 |
//+------------------------------------------------------------------+
int start()
  {
   if( Value == 0.0 ) { Alert( "Invalid Price Entered" ); return(-1); }

   bool ItsAHigh = False; int Multiplier = 0;
   bool     Done = False; int  CountBars = 0;

  //---- Find Value n bar count
  for( int i = 0; i < Bars && !Done ; i++ )
  {
      if( Value == High[i] || Value == Low[i] )
      {
         if( Value == High[i] ) { ItsAHigh = True;  }
         else                   { ItsAHigh = False; }
         Done = True;
      }
      CountBars++;
  }

  //---- Update Multiplier depending on symbol ...
  if( MarketInfo( Symbol(), MODE_DIGITS ) == 2 ) { Multiplier = 10;   }
  else                                           { Multiplier = 1000; }

  //---- Calc Vars
  Value *= Multiplier;
  double Factor = 2.0 * ( ( Angle ) / 360 );
  int  Cycle = MathRound( MathSqrt( Value ) );

  //---- Calculate Cycle Offset
  int Extend = MathMax( 0.01, CountBars-Cycle );

        //---- Draw 18 Res Lines
        for( i = 1; i <= 36; i++ )
        {
            double rv = MathPow( ( MathSqrt( Value ) + ( Factor * i ) ), 2 ) / Multiplier;
            ObjectCreate( StringConcatenate("9squaredfxr0",i) , OBJ_HLINE, 0 , Time[0], rv);
               ObjectSet( StringConcatenate("9squaredfxr0",i) , OBJPROP_WIDTH, Width );
               ObjectSet( StringConcatenate("9squaredfxr0",i) , OBJPROP_STYLE, 2 );
               ObjectSet( StringConcatenate("9squaredfxr0",i) , OBJPROP_COLOR, ResistanceColor );
        }
        //---- Draw 18 Support Lines
        for(    i = 1; i <= 36; i++ )
        {
            rv = MathPow( ( MathSqrt( Value ) - ( Factor * i ) ), 2 ) / Multiplier;
            ObjectCreate( StringConcatenate("9squaredfxs0",i) , OBJ_HLINE, 0 , Time[0], rv);
               ObjectSet( StringConcatenate("9squaredfxs0",i) , OBJPROP_WIDTH, Width );
               ObjectSet( StringConcatenate("9squaredfxs0",i) , OBJPROP_STYLE, 2 );
               ObjectSet( StringConcatenate("9squaredfxs0",i) , OBJPROP_COLOR, SupportColor );
        }
        //---- Draw Start Line
        {
            ObjectCreate( "9squaredfx_001", OBJ_HLINE, 0 , Time[0], Value / Multiplier);
               ObjectSet( "9squaredfx_001", OBJPROP_WIDTH, Width );
               ObjectSet( "9squaredfx_001", OBJPROP_STYLE, 0 );
               ObjectSet( "9squaredfx_001", OBJPROP_COLOR, Plum );
        }

  //---- Draw Fibo Lines
  //-- Time Zones
  if( DisplayFiboCycles )
  {
   ObjectCreate( "9SquaredFibo", 11, 0, Time[CountBars-1], ( Value / Multiplier ), Time[Extend], Close[Extend] );
   ObjectSet( "9SquaredFibo", OBJPROP_LEVELCOLOR, FiboTimeZonesColor );
  }
   //---
   return(0);
  }

//+------------------------------------------------------------------+
void CleanUp()
{
   //---- Start
   ObjectDelete("9squaredfx_001");
   //---- Fib Lines
   ObjectDelete("9SquaredFibo");
    //---- Resistance
   for( int k = 1; k <= 36; k++ )
   {
      ObjectDelete( StringConcatenate("9squaredfxr0",k) );
      ObjectDelete( StringConcatenate("9squaredfxs0",k) );
   }
}
Comments