MTF DeMarker
Download script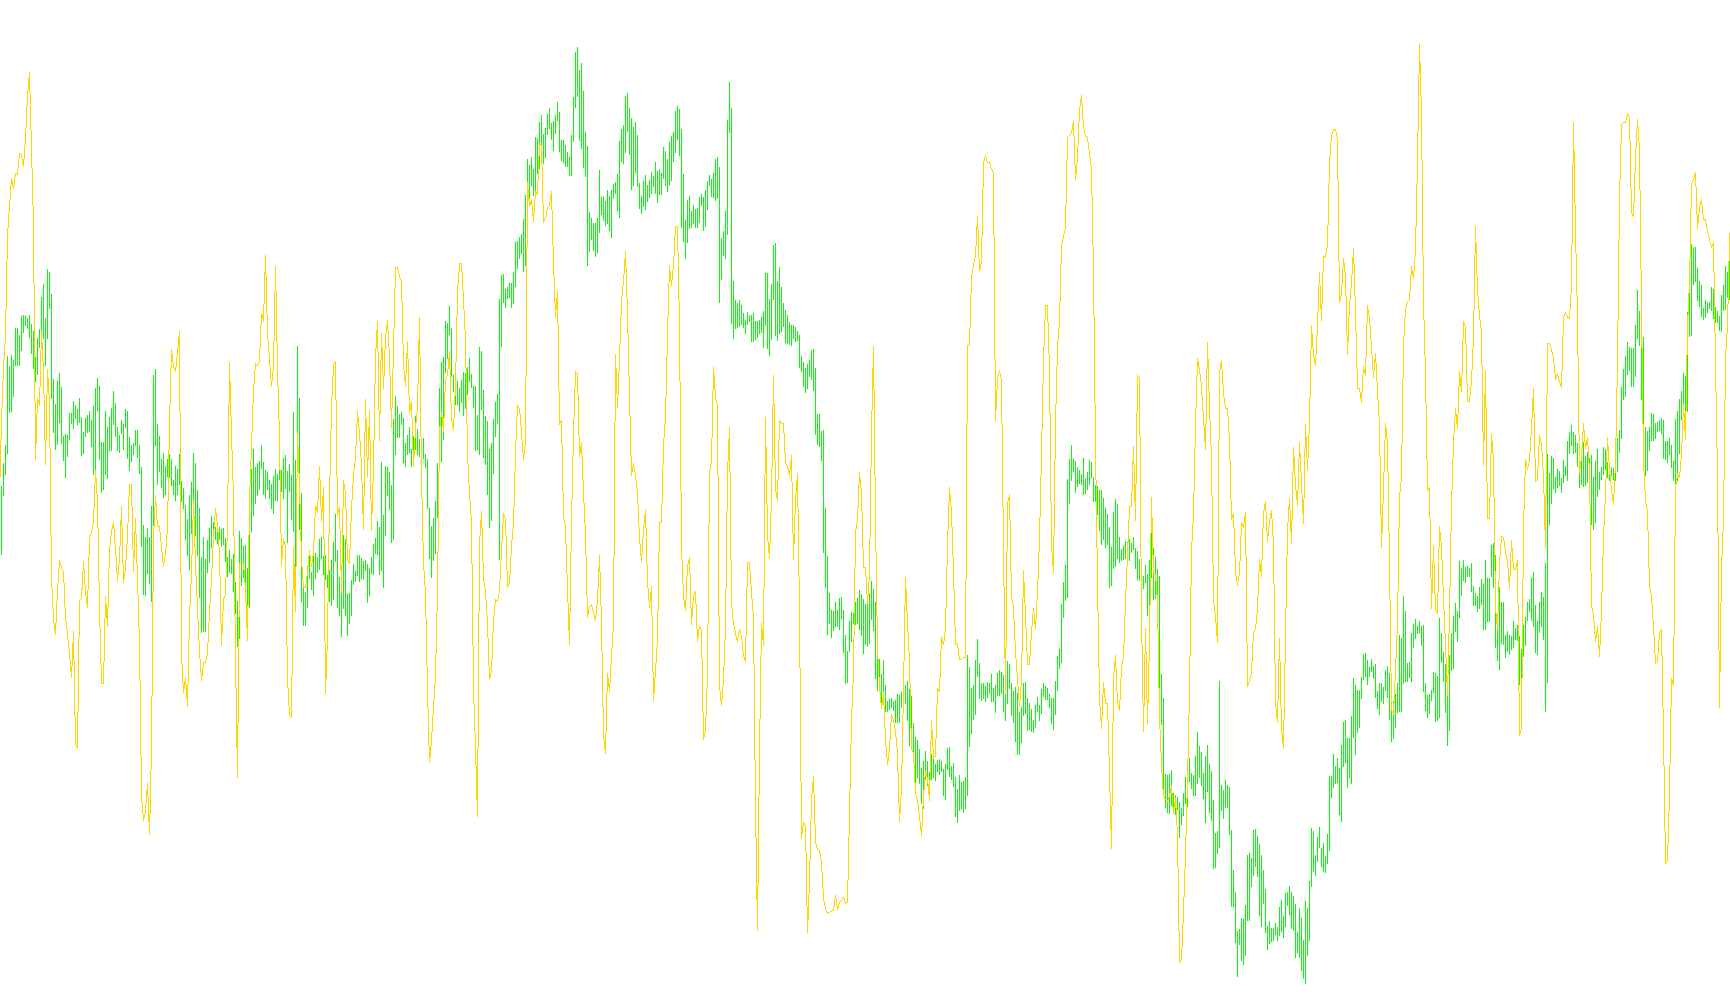
This script functions as a specialized technical analysis tool designed to help traders identify overbought or oversold conditions in the financial markets. Its primary purpose is to take data from one specific timeframe and project it onto another, allowing for a more comprehensive view of market trends.
Core Functionality
The logic operates by utilizing the DeMarker indicator, a momentum-based tool that measures the relationship between price movements and the closing prices of candles. Instead of showing you what is happening only on your current screen (for example, just the 5-minute chart), this script allows you to "peek" into higher timeframes (like the Hourly or Daily charts) without having to switch back and forth between different windows.
How the Logic Works
- Multi-Timeframe Synchronization: The script creates a bridge between timeframes. It identifies the specific timeframe you want to monitor—ranging from minutes to months—and aligns that data with your current viewing area. This means if you are trading on a small, fast-moving chart, you can see the "big picture" signals from a slower, more stable chart simultaneously.
- Data Mapping: The script automatically calculates where the relevant data points from the higher timeframe should sit on your current chart. It ensures that the information remains accurate and synced in real-time as new price bars appear.
- Visual Indicators: The results are displayed in a separate window at the bottom of your trading platform. It uses specific levels (0.3 and 0.7) to serve as visual boundaries:
- When the line reaches high points, it suggests the market may be "overbought."
- When the line drops to low points, it suggests the market may be "oversold."
Key Benefits for the User
By using this logic, you gain the ability to filter out "noise." It helps ensure that a trade taken on a small timeframe is still supported by the broader trend of the larger timeframe. This dual-perspective approach is designed to provide clearer insights into market exhaustion and potential reversal points, helping traders make more informed decisions based on both immediate price action and long-term momentum.
//+------------------------------------------------------------------+
//|                                                 MTF DeMarker.mq4 |
//|                      Copyright © 2005, MetaQuotes Software Corp. |
//|                                        http://www.metaquotes.net |
//+------------------------------------------------------------------+
#property copyright "Copyright © 2009, MetaQuotes Software Corp."
#property link      "http://www.metaquotes.net"

#property indicator_separate_window
#property indicator_minimum 0
#property indicator_maximum 1
#property indicator_buffers 1
#property indicator_color1 DodgerBlue
#property indicator_level1 0.3
#property indicator_level2 0.7

//---- input parameters
extern int ExtDeMarkerPeriod=14;
extern int TimeFrame=0;

//---- buffers
double ExtDeMarkerMapBuffer[];


//+------------------------------------------------------------------+
//| Custom indicator initialization function                         |
//+------------------------------------------------------------------+
int init()
  {

//---- Indicator line

   SetIndexBuffer(0, ExtDeMarkerMapBuffer);
   SetIndexStyle(0,DRAW_LINE);

//---- name for DataWindow and indicator subwindow label

    switch(TimeFrame)
   {
      case 1 : string TimeFrameStr="Period_M1"; break;
      case 5 : TimeFrameStr="Period_M5"; break;
      case 15 : TimeFrameStr="Period_M15"; break;
      case 30 : TimeFrameStr="Period_M30"; break;
      case 60 : TimeFrameStr="Period_H1"; break;
      case 240 : TimeFrameStr="Period_H4"; break;
      case 1440 : TimeFrameStr="Period_D1"; break;
      case 10080 : TimeFrameStr="Period_W1"; break;
      case 43200 : TimeFrameStr="Period_MN1"; break;
      default : TimeFrameStr="Current Timeframe";
   }
   IndicatorShortName("MTF_DeMarker("+ExtDeMarkerPeriod+")("+TimeFrameStr+")");

   return(0);
  }

//+------------------------------------------------------------------+
//| MTF deMark                                                       |
//+------------------------------------------------------------------+
int start()
  {
   datetime TimeArray[];
   int    i,shift,limit,y=0,counted_bars=IndicatorCounted();

// Plot defined timeframe on to current timeframe
   ArrayCopySeries(TimeArray,MODE_TIME,Symbol(),TimeFrame);

   limit=Bars-counted_bars+TimeFrame/Period();

   for(i=0,y=0;i<limit;i++)
   {
   if (Time[i]<TimeArray[y]) y++;

/***********************************************************
   Add your main indicator loop below.  You can reference an existing
      indicator with its iName  or iCustom.
   Rule 1:  Add extern inputs above for all neccesary values
   Rule 2:  Use 'TimeFrame' for the indicator timeframe
   Rule 3:  Use 'y' for the indicator's shift value
 **********************************************************/

ExtDeMarkerMapBuffer[i]=iCustom(NULL,TimeFrame,"DeMarker",0,y);


   }

//


   return(0);
  }

//+------------------------------------------------------------------+
Comments