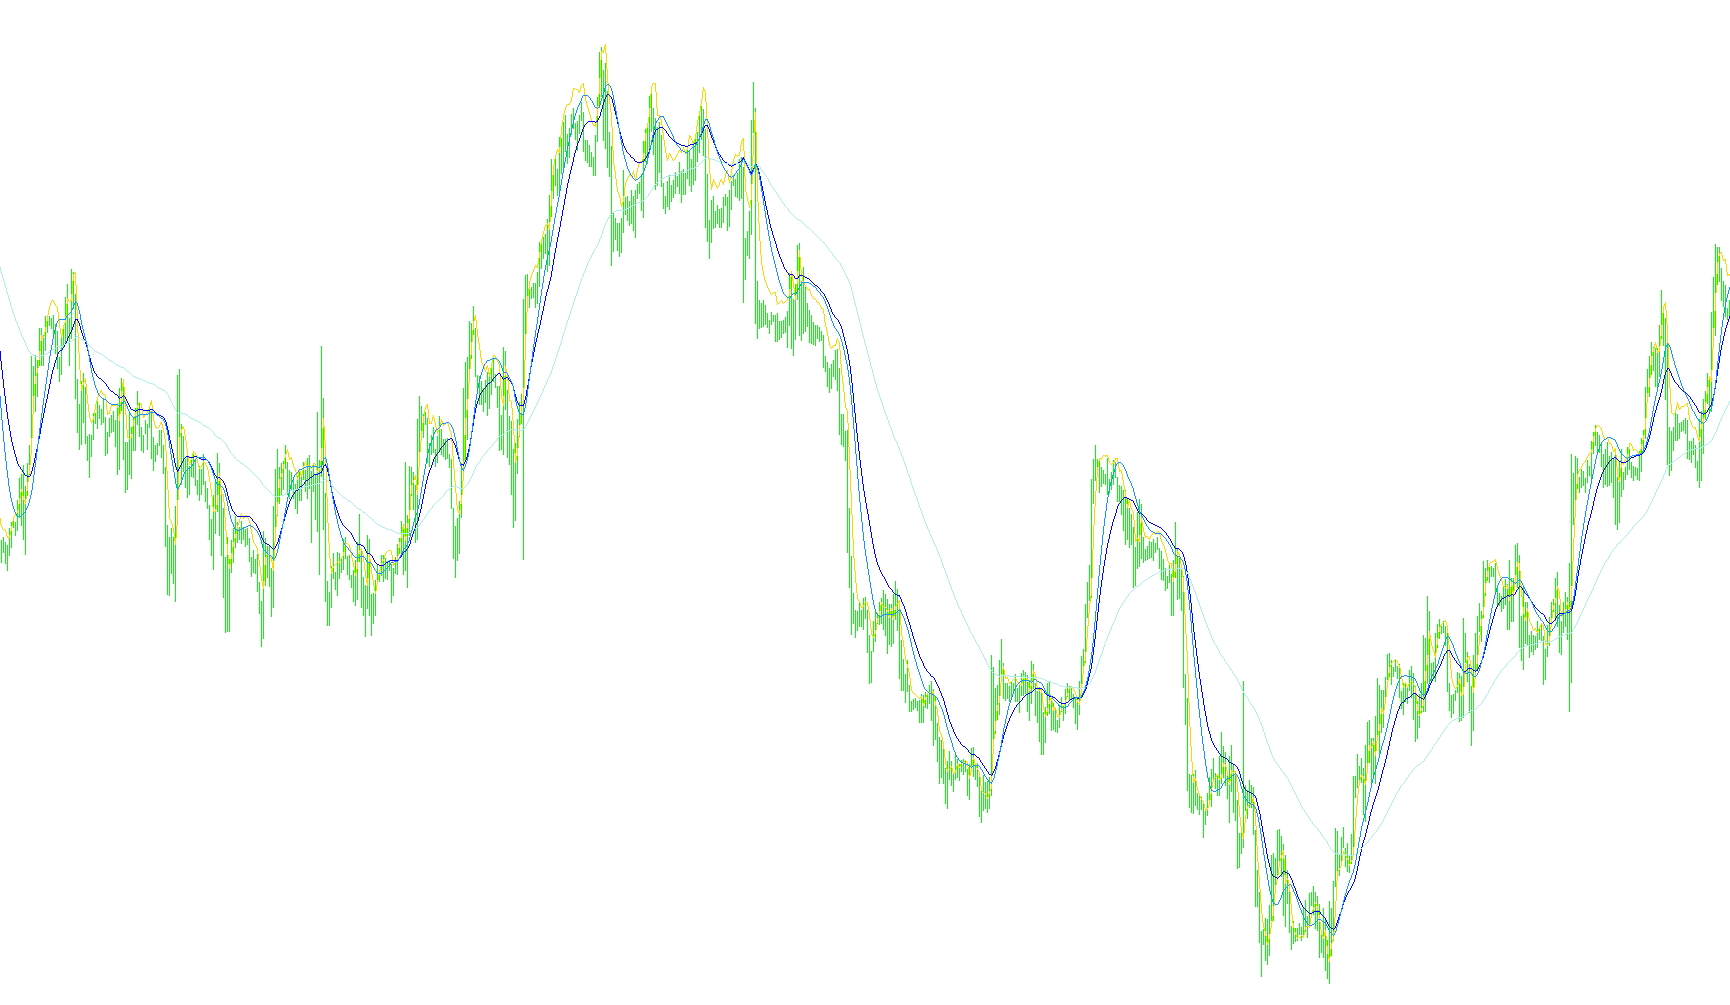
This indicator is designed to provide traders with a visual tool for analyzing price momentum and trend direction by smoothing out market "noise." Instead of looking at raw price movements, it processes data through multiple layers of mathematical averages to create a clearer picture of the market's underlying behavior.
How the Logic Works
The script operates using a layered calculation approach. It doesn't just look at the current price; it builds a foundation of data that progressively filters out volatility. Here is the step-by-step breakdown of that process:
1. The Foundation (Fast Trigger) The logic begins by calculating a "Fast Trigger" line. This is a basic exponential moving average based on the opening prices of the market over a very short period. This serves as the primary raw material for all subsequent calculations, providing a slightly smoothed version of the immediate price action.
2. The Smoothing Layers Once the Fast Trigger is established, the script performs three different types of secondary calculations based entirely on that trigger line, rather than the original price:
- The Slow Trigger: This takes the Fast Trigger and applies a "Smoothed Moving Average." It acts as a buffer to identify broader movements while filtering out minor fluctuations.
- The Main Line: Similar to the Slow Trigger, this uses a longer period of smoothing. It is intended to represent the primary trend of the asset, helping traders see the "big picture" movement over a longer timeframe.
- The TrendOver Line: This uses a different type of weighted average (Linear Weighted Moving Average) on the Fast Trigger. By weighting recent data differently, it provides a specific look at the immediate momentum of the trend.
Summary for Traders
By using these four distinct lines, the tool allows you to distinguish between temporary price spikes and actual structural changes in the market.
- The Fast Trigger reacts quickly to new information.
- The Slow Trigger and Main Line provide stability, helping you identify the general direction the market is heading.
- The TrendOver line assists in identifying the current strength or "weight" of the movement.
By observing how these lines interact with one another—specifically how they cross or diverge—traders can better identify potential entry points and trend reversals in a more organized, visual manner.
//+------------------------------------------------------------------+
//|                                                  MA_Gideon       |
//|                      Copyright © 2004, MetaQuotes Software Corp. |
//|                                       http://www.metaquotes.net/ |
//+------------------------------------------------------------------+
//+------------------------------------------------------------------+

//+------------------------------------------------------------------+
#property  copyright "Copyright © 2007, GideonSmolders(at)gmail.com."
#property  link      ""
//---- indicator settings
#property  indicator_separate_window
#property  indicator_buffers 4
#property  indicator_color1  Blue
#property  indicator_color2  LightBlue
#property  indicator_color3  LightPink
#property  indicator_color4  LightGreen

extern double slowPeriod=9;
extern double MainPeriod=35;
extern double TrendOverPeriod=14;


//---- indicator buffers

string signal;
double fastTrigger[];
double slowTrigger[];
double MainLine[];
double TrendOver[];


//+------------------------------------------------------------------+
//| Custom indicator initialization function                         |
//+------------------------------------------------------------------+
int init()
  {
//---- 2 additional buffers are used for counting.
//   IndicatorBuffers(4);

   SetIndexDrawBegin(0,30);
   SetIndexDrawBegin(1,30);
   SetIndexDrawBegin(2,30);
   SetIndexDrawBegin(3,30);

   SetIndexStyle(0,DRAW_LINE,STYLE_SOLID,1);
   SetIndexStyle(1,DRAW_LINE,STYLE_SOLID,1);
   SetIndexStyle(2,DRAW_LINE,STYLE_SOLID,1);
   SetIndexStyle(3,DRAW_LINE,STYLE_SOLID,1);

   SetIndexBuffer(0,fastTrigger);
   SetIndexLabel(0,"fastTrigger");
   SetIndexBuffer(1,slowTrigger);
   SetIndexLabel(1,"slowTrigger");
   SetIndexBuffer(2,MainLine);
   SetIndexLabel(2,"Main Line");
   SetIndexBuffer(3,TrendOver);
   SetIndexLabel(3,"TrendOver");

//   ArraySetAsSeries(fastTrigger, true);


//---- name for DataWindow and indicator subwindow label


//---- initialization done
   return(0);
  }
//+------------------------------------------------------------------+
//| Calculations                                    |
//+------------------------------------------------------------------+
int start()
  {
//   int limit=ArraySize(fastTrigger);
   int limit;
   int i;
//   int counted_bars=300;
   int counted_bars=IndicatorCounted();
//---- check for possible errors
   if(counted_bars<0) return(-1);
//---- last counted bar will be recounted
   if(counted_bars>0) counted_bars--;
   limit=Bars-counted_bars;

//---- main loop

//---- done

   for(i=0; i <= limit; i++)
   {
   fastTrigger[i]=  iMA(Symbol(),0,3,0,MODE_EMA,PRICE_OPEN,i);
   }
   for(i=0; i <= limit; i++)
   {
   slowTrigger[i] = iMAOnArray(fastTrigger,0,slowPeriod,0,MODE_SMMA,i);
   MainLine[i]= iMAOnArray(fastTrigger,0,MainPeriod,0,MODE_SMMA,i);
   TrendOver[i]= iMAOnArray(fastTrigger,0,TrendOverPeriod,0,MODE_LWMA,i);
   }
//   for(i=0; i <= limit; i++)
//   {
//   MainLine[i]= iMAOnArray(fastTrigger,0,MainPeriod,0,MODE_SMMA,i);
//   }
//   for(i=0; i <= limit; i++)
//   {
//   TrendOver[i]= iMAOnArray(fastTrigger,0,TrendOverPeriod,0,MODE_LWMA,i);
//   }
  }
//+------------------------------------------------------------------+
Comments