MAX Moving Average
Download script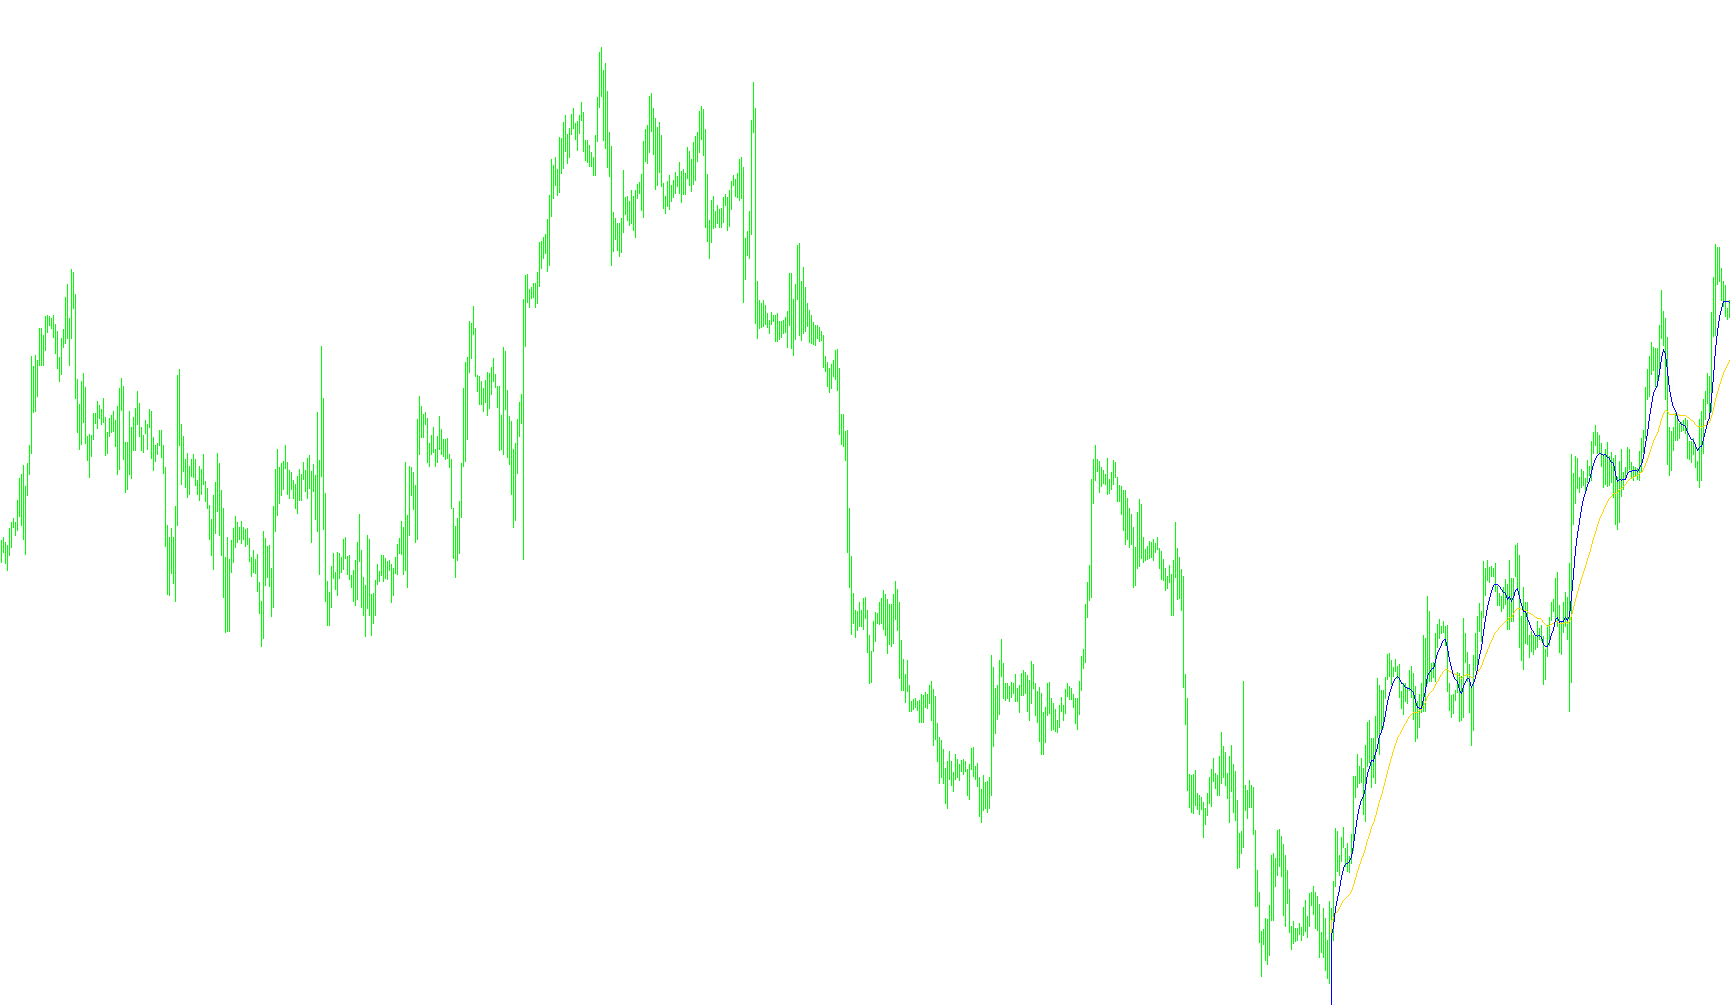
This script is designed as a technical analysis tool for trading platforms, specifically created to visualize price trends by calculating weighted averages. Unlike standard moving averages that treat all past price data with equal importance, this logic applies a specific mathematical emphasis to different points in time to help identify momentum and trend direction.
Core Methodology: Weighted Distribution
The script operates on the principle of "weighting." In financial markets, some historical data is often considered more relevant than others. This tool processes price data by assigning a mathematical multiplier to each price point based on its distance from the current moment. By using a "power" variable, the script can amplify or dampen how much influence specific past prices have on the final result.
How the Calculation Works
The logic performs two distinct types of calculations simultaneously to provide a comprehensive view of the market:
- Primary Long-Term Analysis: The script looks back over a significant historical period (determined by the "firstback" setting). It calculates a weighted average where the weights decrease as they move further into the past. This helps smooth out minor price fluctuations and highlights the broader trend of the asset.
- Secondary Short-Term Analysis: Simultaneously, the script performs a similar calculation over a much shorter timeframe (determined by the "secondback" setting). This captures more immediate price action and "noise," allowing for a quicker reaction to recent market changes.
Visual Output
The final result of these calculations is plotted on your trading chart as lines. By processing the data in two different "look-back" windows with varying intensities:
- Trend Identification: The user can see where the immediate price movement aligns with the long-term historical trend.
- Momentum Tracking: Because the script uses a power-based multiplier, it highlights how quickly the price is accelerating or decelerating.
- Dynamic Response: Rather than just showing a flat average, the lines react dynamically to price changes, with the weighting ensuring that the most "relevant" data points have the greatest impact on the line's position.
In essence, this tool provides a way to see through the market noise by prioritizing certain historical periods over others, helping traders distinguish between temporary price spikes and sustained directional moves.
#property link      "http://www.themovingaverage.com"
#property indicator_chart_window

#property indicator_buffers 4
#property indicator_color1 Red
#property indicator_color2 Red
#property indicator_color3 Red
#property indicator_color4 Red

double ExtMapBuffer1[];
double ExtMapBuffer2[];
double ExtMapBuffer3[];
double ExtMapBuffer4[];

extern int firstback=50;
extern int secondback=14;
extern int countbars=200;
extern int power=2;

int init()
  {
   SetIndexStyle(0,DRAW_LINE);
   SetIndexBuffer(0,ExtMapBuffer1);
   SetIndexStyle(1,DRAW_LINE);
   SetIndexBuffer(1,ExtMapBuffer2);
   SetIndexStyle(2,DRAW_LINE);
   SetIndexBuffer(2,ExtMapBuffer3);
   SetIndexStyle(3,DRAW_LINE);
   SetIndexBuffer(3,ExtMapBuffer4);
   return(0);
  }
int deinit()
  {
   return(0);
  }
int start()
  {
   int counted_bars=IndicatorCounted();
   int pos;
   int cnt;
   int mult;
   double first,second;
   ArrayInitialize(ExtMapBuffer1,0);
   ArrayInitialize(ExtMapBuffer2,0);
   pos=countbars;
   while (pos>-1)
   {
      mult=firstback+1;
      first=0;
      second=0;
      for (cnt=pos;cnt<pos+firstback;cnt++)
      {
         mult--;
         first=first+(Close[cnt]*MathPow(mult,power));
         Print (cnt);
      }
      mult=firstback+1;
      for (cnt=pos;cnt<pos+firstback;cnt++)
      {
         mult--;
         second=second+MathPow(mult,power);
      }
      ExtMapBuffer1[pos]=first/second;
      pos--;
   }

   pos=countbars;
   while (pos>-1)
   {
      mult=secondback+1;
      first=0;
      second=0;
      for (cnt=pos;cnt<pos+secondback;cnt++)
      {
         mult--;
         first=first+(Close[cnt]*MathPow(mult,power));
         Print (cnt);
      }
      mult=secondback+1;
      for (cnt=pos;cnt<pos+secondback;cnt++)
      {
         mult--;
         second=second+MathPow(mult,power);
      }
      ExtMapBuffer2[pos]=first/second;
      pos--;
   }
   return(0);
  }
Comments