#_i_FFT_separate_Close2_D_diff
Download script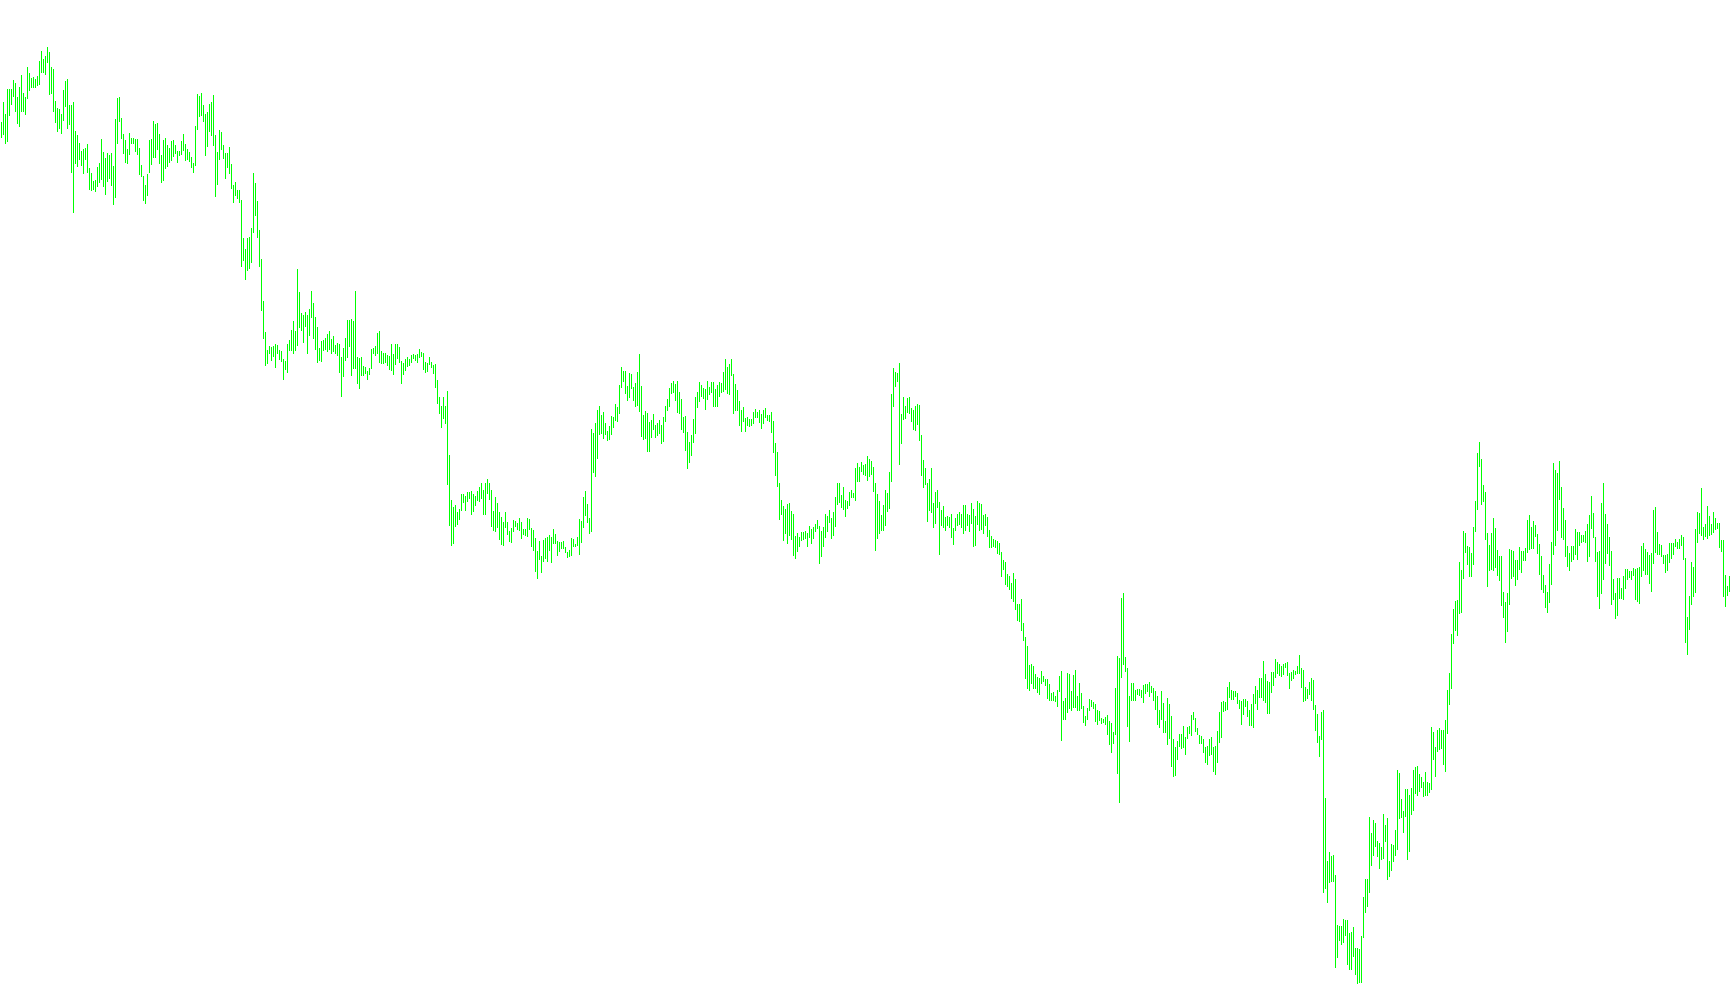
Overview of the Spectral Analysis Tool
This tool is designed to analyze price movements by looking at the underlying "frequencies" of a financial instrument. Instead of just looking at whether the price is going up or down in the moment, this script treats market data similarly to sound waves or radio signals, attempting to break down complex price action into different cycles and vibrations.
How the Logic Works
1. Data Collection and Comparison The tool works by looking at two different snapshots of the market at once. It takes a set of recent closing prices and compares them against a second set of prices from a slightly different point in time (a "shifted" period). By comparing these two windows, the script can identify how the momentum and rhythm of the price are changing over time.
2. Frequency Transformation The core of this script relies on a mathematical process that converts standard price data into a frequency spectrum. It takes the raw price movements and translates them into "cycles." This allows the tool to see which types of cycles—such as fast, high-frequency fluctuations or slow, long-term trends—are currently dominant in the market.
3. Filtering the Noise Not all market movement is useful for analysis; some of it is just random "noise." The script includes a filtering mechanism that allows you to define specific boundaries for which frequencies to pay attention to. It effectively ignores very low-frequency movements (which might be too slow to be relevant) and very high-frequency movements (which might be too erratic), focusing only on the range that provides the most meaningful information.
4. Reconstructing the Result After filtering out the unwanted noise and identifying the key cycles, the tool performs a reverse calculation to bring that data back into a visual format that can be seen on your chart.
5. Visual Output The final result is displayed in three distinct visual components:
- Two Histograms: These represent the magnitude of the difference between the two compared price windows, specifically highlighting the intensity of the price movement.
- A Line Plot: This provides a continuous view of the differences calculated by the analysis, helping to visualize the "gap" or divergence between the filtered data sets.
Summary for the User
Essentially, this script acts like a "prism" for market prices. Just as a prism breaks white light into different colors, this tool breaks down price action into different frequencies. It filters out the "haze" of the market to show you the core rhythmic movements, allowing you to see the difference between two points in time more clearly than a standard chart would permit.
//+------------------------------------------------------------------+
//|                                            #_i_SpecktrAnalis.mq4 |
//|                                          Copyright © 2006, klot. |
//|                                                     klot@mail.ru |
//+------------------------------------------------------------------+
#property copyright "Copyright © 2006, klot."
#property link      "klot@mail.ru"


#import "#_lib_FFT.ex4"
void realfastfouriertransform(double& a[], int tnn, bool inversefft);
#import

#property indicator_separate_window
#property indicator_buffers 3
#property indicator_color1 Red
#property indicator_color2 Blue
#property indicator_color3 Yellow
#property indicator_level1 0.0
//#property indicator_level1 0.0
//#property indicator_level1 0.0
//---- buffers
double Buffer1[];
double Buffer2[];
double Buffer3[];
//---
extern int n=7; // Äëèíà ðÿäà
extern int Fmin=30;//80;//2; // Ãðíèöà Ôèëüòðà ïî Í×.
extern int Fmax=60;//128; // Ãðàíèöà Ôèëüòðà ïî Â×.
//extern string sym="GBPUSD";
extern int shift=6;//extern string sym="EURUSD";

double aa[];
double bb[];
int N;

//+------------------------------------------------------------------+
//| Custom indicator initialization function                         |
//+------------------------------------------------------------------+
int init()
  {
//---- indicators
SetIndexStyle(0,DRAW_HISTOGRAM,0,2);
SetIndexBuffer(0,Buffer1);
SetIndexStyle(1,DRAW_HISTOGRAM,0,2);
SetIndexBuffer(1,Buffer2);
SetIndexStyle(2,DRAW_LINE,0,2);
SetIndexBuffer(2,Buffer3);
//---
   N=MathPow(2,n);
   ArrayResize(aa,N);
   ArrayResize(bb,N);

if( Fmax>=N ) Fmax=N;
if( Fmin<=2 ) Fmin=2;

//----
   return(0);
  }
//+------------------------------------------------------------------+
//| Custom indicator deinitialization function                       |
//+------------------------------------------------------------------+
int deinit()
  {
//----

//----
   return(0);
  }
//+------------------------------------------------------------------+
//| Custom indicator iteration function                              |
//+------------------------------------------------------------------+
int start()
  {

   if( Bars<N+shift) return(0);

   //---
   for(int i=N-1; i>=0; i--)
   {
     aa[i]=iClose(Symbol(),0,i);
     bb[i]=iClose(Symbol(),0,i+shift);
   }
   //---
   realfastfouriertransform(aa, N, false);
   realfastfouriertransform(bb, N, false);
   //---
   N=ArraySize(aa);
   //Comment("n= ",N);
   //---
   for( i=0; i<=N-1; i++)
   {
      if( i<Fmin || i>Fmax) { aa[i]=0.0;bb[i]=0.0; }
   }
   //---
   realfastfouriertransform(aa, N, true);
   realfastfouriertransform(bb, N, true);
   //---
   SetIndexDrawBegin(0,Bars-N);
   //SetIndexDrawBegin(1,Bars-N-shift);
   SetIndexDrawBegin(1,Bars-N);
   //---
   for( i=0; i<=N-1; i++)
   {
       double diff1=bb[i]-aa[i];
      if (diff1<0)
        Buffer2[i]=-diff1;
      //Buffer2[i+shift]=bb[i];
      else if (diff1>0)
        Buffer1[i]=-diff1;
      Buffer3[i]=-diff1;

   }
   //----
   return(0);
  }
//-------------------------------------------------------------------+
Comments