ma_altMA
Download script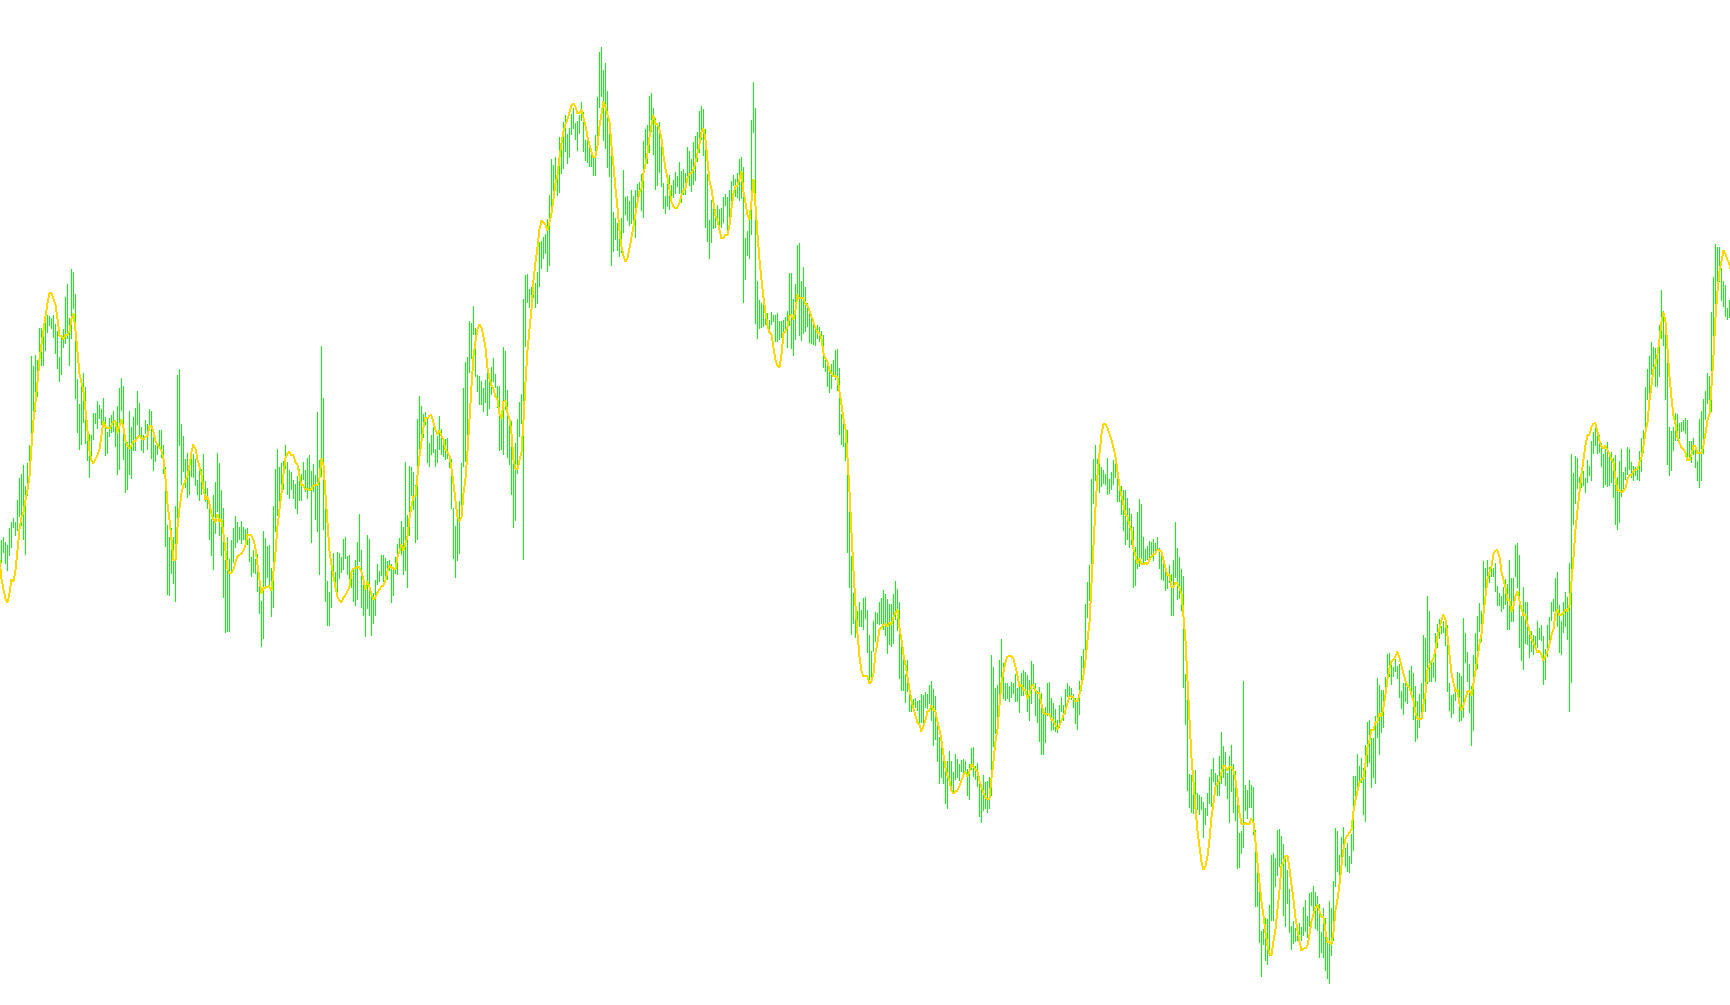
This tool is designed to provide traders with a visual aid for identifying price momentum and potential trend shifts by calculating a specialized weighted moving average. Instead of relying on standard averages that treat all past data points equally, this script applies a specific mathematical logic to emphasize certain price movements over others.
Core Logic and Methodology
The primary objective of the script is to generate a dynamic "Trigger Line." This is achieved through a multi-step calculation process:
1. Weighted Calculation System The script evaluates a specific look-back period (defined by user settings) and calculates a weighted sum of closing prices. Rather than giving every day or candle equal importance, the logic applies a multiplier that adjusts based on the position of the price within the timeframe. This creates a weighted value that is more sensitive to recent structural changes in the market while still maintaining a connection to historical data.
2. Smoothing and Trend Filtering To prevent the indicator from reacting too erratically to "market noise," the script takes the weighted values generated in the previous step and processes them through a secondary smoothing calculation (an LSMA-style logic). This creates a refined line that follows the general flow of the market momentum more smoothly than raw price data.
3. Visual Signaling (The "Trigger") The most important feature for the user is how the script handles these two calculations—the raw weighted value and the smoothed trend line. The tool compares these two figures in real-time:
- The script identifies when the immediate weighted momentum is moving in harmony with the smoother trend.
- It uses a conditional "filter" to hide specific parts of the data. Essentially, it only renders the visual line on your chart when the current weighted value sits above the smoothed average.
Summary for Traders
In practical terms, this script acts as a momentum filter. It ignores signals that do not meet a specific strength threshold, effectively "cleaning" the chart to show only the moments where price momentum is actively aligning with its moving average. By visually suppressing data that falls below the calculated smoothing threshold, it helps traders focus on active trends while filtering out weaker, non-significant price movements.
//+------------------------------------------------------------------+
//|                                                     Trigger Line |
//|                             Copyright © 2005 dwt5 and adoleh2000 |
//|                                        http://www.metaquotes.net |
//+------------------------------------------------------------------+
#property  copyright "Copyright © 2005 dwt5 and adoleh2000 "
#property  link      "http://www.metaquotes.net/"

//---- indicator settings
#property  indicator_chart_window
#property  indicator_buffers 1
#property indicator_color1 Red

//---- buffers
double ExtMapBuffer1[];
double ExtMapBuffer2[];
double ExtMapBuffer3[];
double ExtMapBuffer4[];

int width;

extern int Rperiod = 15;
extern int LSMA_Period = 5;
extern int Div = 3;
int Draw4HowLong;
int shift;
int i;
int j;
int loopbegin;
int length;
int lsma_length;

double lengthvar;
double tmp ;
double tmp2 ;
double wt[];
double sum[];
double lsma_sum[];
double lsma_ma[];
double middle[];
int c;

//+------------------------------------------------------------------+
//| Custom indicator initialization function                         |
//+------------------------------------------------------------------+
int init()
  {
//---- 7 additional buffers are used for counting.
   IndicatorBuffers(7);

//---- drawing settings

   SetIndexBuffer(0,ExtMapBuffer1);
   SetIndexStyle(0,DRAW_LINE,STYLE_SOLID,2);

   SetIndexBuffer(1,ExtMapBuffer2);
   SetIndexStyle(1,DRAW_NONE,STYLE_SOLID,2);

   SetIndexBuffer(2,ExtMapBuffer3);
   SetIndexStyle(2,DRAW_NONE,STYLE_SOLID,2);

   SetIndexBuffer(3,ExtMapBuffer4);
   SetIndexStyle(3,DRAW_NONE,STYLE_SOLID,2);


   SetIndexBuffer(4,sum);
   SetIndexBuffer(5,wt);
   SetIndexBuffer(6,lsma_ma);

//---- initialization done
   return(0);
  }

int start()

  {   Draw4HowLong = Bars-Rperiod - 5;                            //Rperiod = 20
      length = Rperiod;                                           //length now = 20
      lsma_length = LSMA_Period;
      loopbegin = Draw4HowLong - length - 1;


      for(shift = loopbegin; shift >= 0; shift--)  //  MAIN For Loop
      {
         sum[1] = 0;
         for(i = length; i >= 1  ; i--)             //LSMA loop
         {
         lengthvar = length + 1;                               //lengthvar = 21
         lengthvar /= Div;                                       //lengthvar = 7
         tmp = 0;
         tmp = ( i - lengthvar)*Close[length-i+shift];         //tmp = 20 - 7 * close[20-i+shift]
         sum[1]+=tmp;
         }
         wt[shift] = sum[1]*6/(length*(length+1));
         j = shift;
         lsma_ma[shift] = wt[j+1] + (wt[j]-wt[j+1])* 2/(lsma_length+1);


//========== COLOR CODING ===========================================


            ExtMapBuffer1[shift] = wt[shift];
            ExtMapBuffer2[shift] = lsma_ma[shift];
            ExtMapBuffer3[shift] = wt[shift];
            ExtMapBuffer4[shift] = lsma_ma[shift];


            if (wt[shift]  < lsma_ma[shift])
            {
                ExtMapBuffer4[shift] = EMPTY_VALUE;
                ExtMapBuffer3[shift] = EMPTY_VALUE;
           }

        }
  }
//+------------------------------------------------------------------+
Comments