LSMA test 1_v1
Download script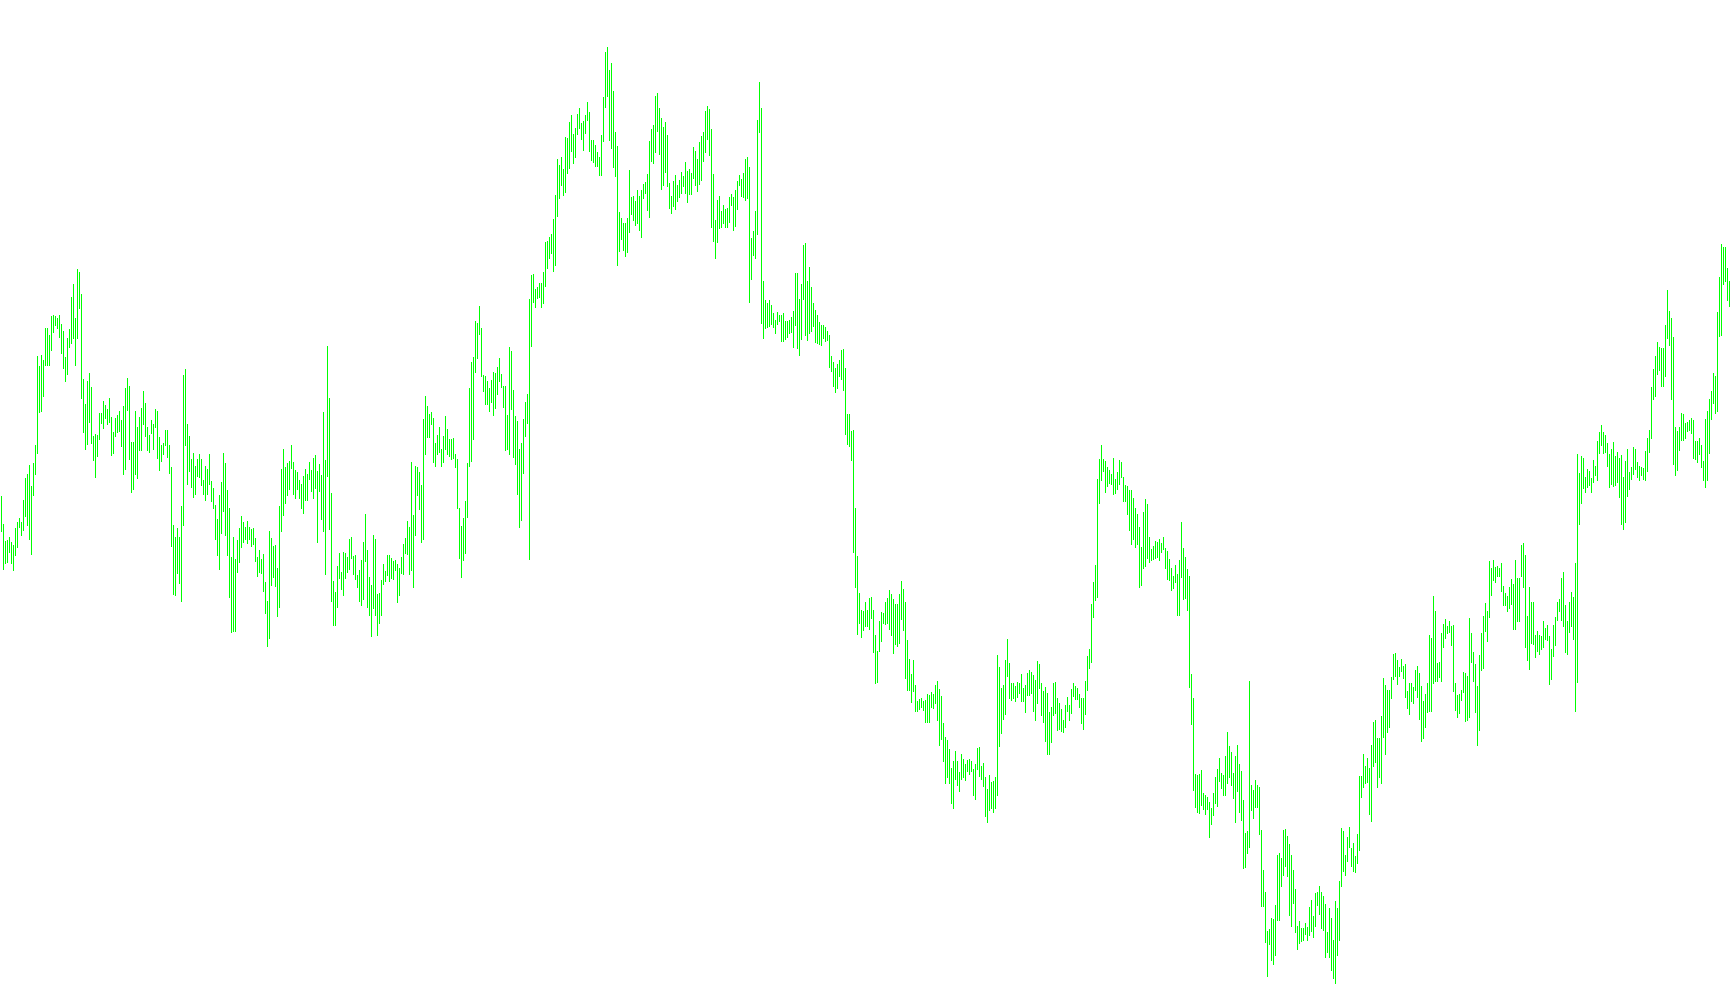
This technical indicator is designed for the MetaTrader platform to provide visual signals on a trading chart. Its primary purpose is to translate complex market data into easy-to-read visual cues, specifically focusing on trend identification and price action dynamics.
Core Functionality
The script operates by scanning historical price data and identifying specific patterns that correlate with market momentum. Rather than overwhelming the user with raw numbers, it converts these calculations into distinct geometric symbols (arrows, dots, and boxes) directly on the main chart window. This allows a trader to see "buy" or "sell" signals instantly without having to manually interpret multiple underlying oscillators.
Visual Signal Logic
The indicator utilizes a dual-color coding system to differentiate between market sentiments:
- Bearish Signals (Red Symbols): These markers appear when the logic detects downward pressure or a potential decline in price. These include specific shapes like down arrows, large dots, and open boxes, all designed to alert the user to possible selling opportunities or bearish trend shifts.
- Bullish Signals (White Symbols): These markers indicate upward momentum or potential gains. By using white arrows, dots, and "X" boxes, the tool highlights areas where the market may be strengthening, signaling potential buying interest.
Data Processing & Integration
The script performs its analysis by pulling information from external technical components. It specifically monitors trends to determine whether the market is in a state of "flip" (changing direction) or maintaining a steady flow.
To ensure accuracy, the tool looks at various technical layers—including moving averages and volatility indicators—to filter out market "noise." The goal of this logic is to provide a refined view of the market, ensuring that the symbols displayed on your chart represent significant shifts in price action rather than minor, insignificant fluctuations.
Summary for the User
Essentially, this tool acts as an automated analyst. It looks at the heavy lifting of calculating trends and momentum in the background and communicates the results to you through simple, color-coded icons. It is built to help you quickly identify whether the current market environment favors a bullish (White) or bearish (Red) approach.
//+------------------------------------------------------------------+
//| 5 Min RSI 12-period qual INDICATOR                               |
//+------------------------------------------------------------------+
#property copyright "Ron T"
#property link      "http://www.lightpatch.com"

#property indicator_chart_window
#property indicator_buffers 8

#property indicator_color1 Red
#property indicator_color2 Red
#property indicator_color3 Red
#property indicator_color4 Red

#property indicator_color5 White
#property indicator_color6 White
#property indicator_color7 White
#property indicator_color8 White


//---- buffers
double Buffer1[];
double Buffer2[];
double Buffer3[];
double Buffer4[];
double Buffer5[];
double Buffer6[];
double Buffer7[];
double Buffer8[];


// User Input


//+------------------------------------------------------------------+
//| Custom indicator initialization function                         |
//|------------------------------------------------------------------|

int init()
  {

   // 233 up arrow
   // 234 down arrow
   // 159 big dot
   // 168 open square
   // 120 box with X

   SetIndexStyle(0,DRAW_ARROW);  //RED ARROW
   SetIndexBuffer(0, Buffer1);
   SetIndexArrow(0,234);

   SetIndexStyle(1,DRAW_ARROW);
   SetIndexBuffer(1, Buffer2);
   SetIndexArrow(1,159);

   SetIndexStyle(2,DRAW_ARROW);  //RED OPEN BOX
   SetIndexBuffer(2, Buffer3);
   SetIndexArrow(2,120);

   SetIndexStyle(3,DRAW_ARROW);  //RED DOT
   SetIndexBuffer(3, Buffer4);
   SetIndexArrow(3,159);


   SetIndexStyle(4,DRAW_ARROW);  //WHITE ARROW
   SetIndexBuffer(4, Buffer5);
   SetIndexArrow(4,233);

   SetIndexStyle(5,DRAW_ARROW);
   SetIndexBuffer(5, Buffer6);
   SetIndexArrow(5,159);

   SetIndexStyle(6,DRAW_ARROW);  //WHITE X BOX
   SetIndexBuffer(6, Buffer7);
   SetIndexArrow(6,120);

   SetIndexStyle(7,DRAW_ARROW);  //RED DOT
   SetIndexBuffer(7, Buffer8);
   SetIndexArrow(7,159);

   return(0);
  }


//+------------------------------------------------------------------+
//| Custor indicator deinitialization function                       |
//+------------------------------------------------------------------+
int deinit()
  {
   int i;

   for( i=0; i<Bars; i++ ) Buffer1[i]=0;
   for( i=0; i<Bars; i++ ) Buffer2[i]=0;
   for( i=0; i<Bars; i++ ) Buffer3[i]=0;
   for( i=0; i<Bars; i++ ) Buffer4[i]=0;
   for( i=0; i<Bars; i++ ) Buffer5[i]=0;
   for( i=0; i<Bars; i++ ) Buffer6[i]=0;
   for( i=0; i<Bars; i++ ) Buffer7[i]=0;
   for( i=0; i<Bars; i++ ) Buffer8[i]=0;

   return(0);
  }


//+------------------------------------------------------------------+
//| Custom indicator iteration function                              |
//+------------------------------------------------------------------+
int start()
  {
   int      pos=350; // leave room for moving average periods

   double   cEMA10=0, pEMA10=0;
   double   cEMA40=0, pEMA40=0;
   double   cSAR=0,   pSAR=10;

   bool      rising=false;
   bool     falling=false;

   bool       sarLO=false;
   bool       sarHI=false;

   bool      flipUP=false;
   bool      flipDN=false;

   double x=0;


   int      dCROSS;    // how many periods since last MA cross

   int      above=0;   // how long SAR has been up
   int      below=0;   // how long SAR has been down

   double    p=Point();

   bool      Over=false;
   bool      Under=false;


   // 1 RED    DOWN ARROW
   // 2 RED
   // 3 RED    BIG OPEN BOX
   // 4 RED    BIG DOT
   // 5 WHITE  UP ARROW
   // 6 WHITE
   // 7 WHITE  BIG X BOX
   // 8 WHITE  BIG DOT

   while(pos>=0)
     {
      x=iCustom(Symbol(),PERIOD_M30,"LSMA_in_Color.ex4","48,1500",0,0);
      Buffer1[pos]=x;


 	   pos--;
     }

   return(0);
  }
//+------------------------------------------------------------------+
Comments