LSMA_ind_01b_v1
Download script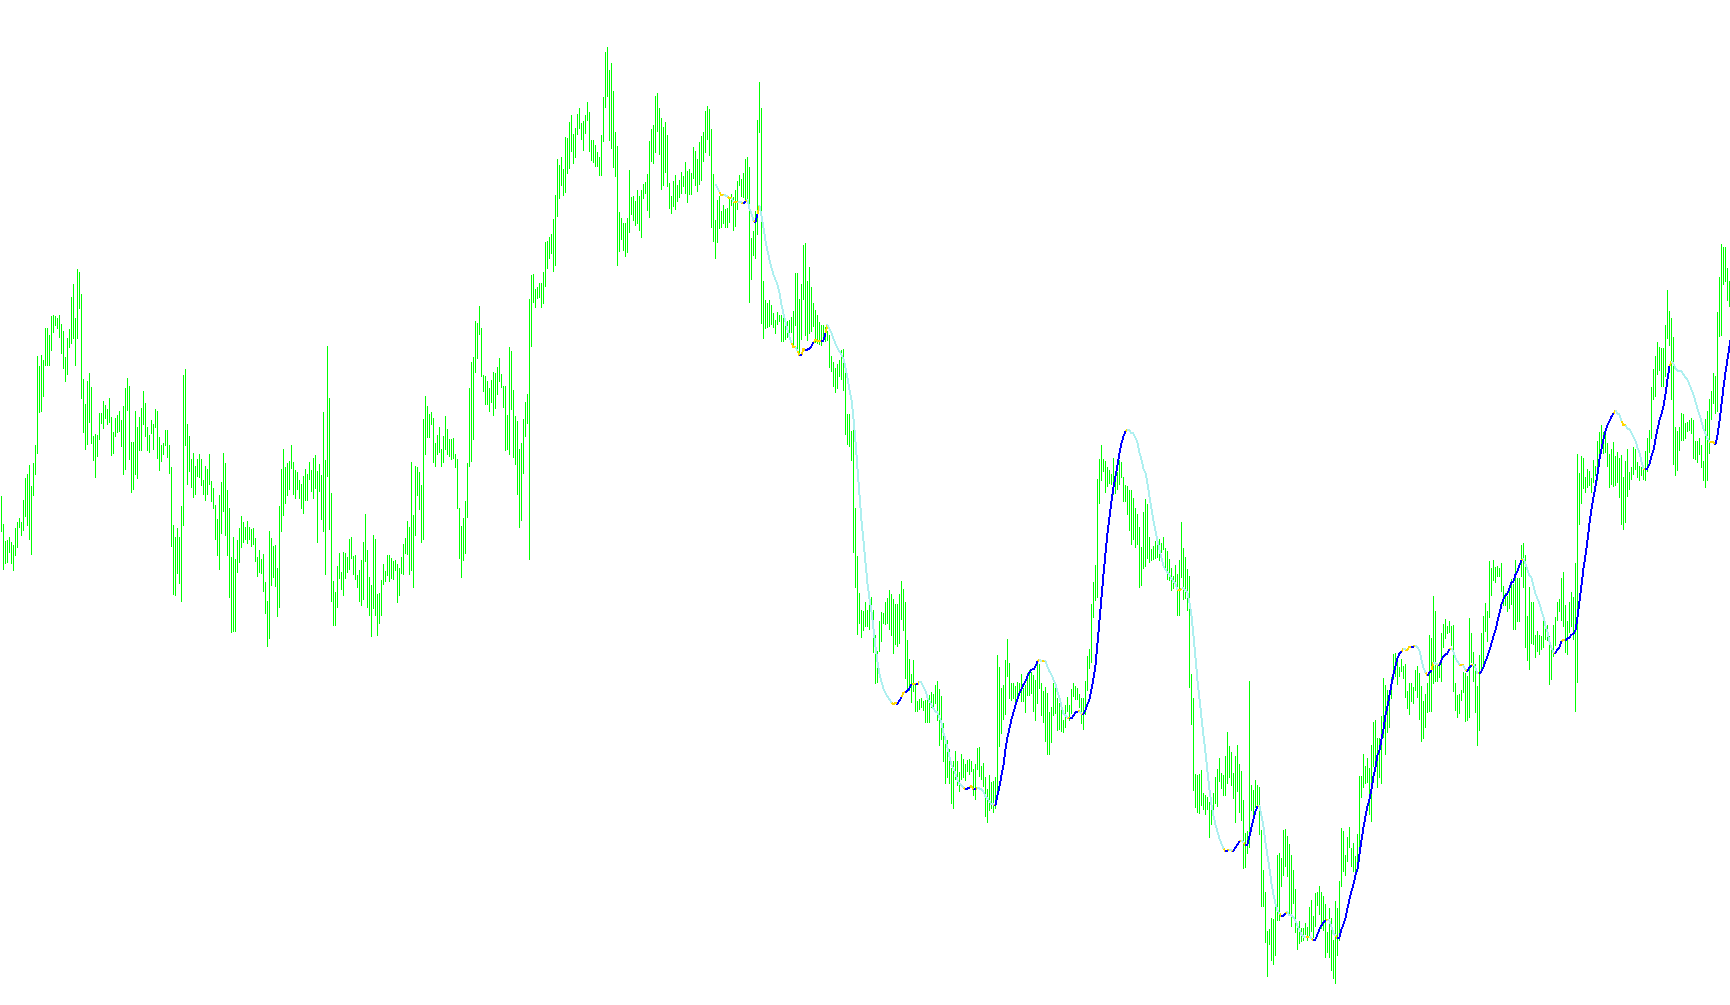
This tool is designed as a visual trend indicator for financial charts, specifically created to help traders identify the direction and momentum of price movements in real-time. Rather than just showing raw price data, it processes historical information to create a smoothed visual representation of market behavior.
Core Logic and Mechanics
The script operates by analyzing a specific window of recent price history (defined by the "Period" setting). It looks at the closing prices over this duration and applies a mathematical weight to them. This means that instead of treating every past price as equally important, the logic calculates a weighted average to determine the current "strength" of the trend.
How it Visualizes Data
The primary goal of the script is to translate complex numerical calculations into a clear, color-coded visual line on your chart:
- Trend Calculation: The script constantly compares the current calculated value against the previous one. By looking at these infinitesimal changes, it determines if the market momentum is shifting upward, downward, or remaining stagnant.
- Dynamic Color Coding: To make the data easier to read at a glance, the indicator uses three distinct colors (Yellow, Green, and Red). The logic automatically hides certain lines and highlights others based on whether the trend is rising or falling.
- Visual Clarity: By "emptying" specific data points when conditions aren't met, the script prevents the chart from becoming cluttered with messy overlapping lines. It ensures that only the most relevant directional information is visible to the user at any given moment.
Summary for the User
In simple terms, this script acts as a filter. It takes out the "noise" of constant price flickering and summarizes the market movement into a smooth, color-coded path. It tells you what the trend is doing right now by comparing where the price was a few moments ago to where it is heading next, providing a cleaner visual guide for identifying potential moves in the market.
//+------------------------------------------------------------------+
//|                                                        |
//|                      Copyright © 2004, MetaQuotes Software Corp. |
//|                                       http://www.metaquotes.net/ |
//+------------------------------------------------------------------+
#property  copyright "Copyright © 2005, FX Sniper "
#property  link      "http://www.metaquotes.net/"

//---- indicator settings
#property  indicator_chart_window
#property  indicator_buffers 3
#property indicator_color1 Yellow
#property indicator_color2 Green
#property indicator_color3 Red

//---- buffers
double ExtMapBuffer1[];
double ExtMapBuffer2[];
double ExtMapBuffer3[];
int width;

extern int Rperiod = 34;
extern int Draw4HowLong = 500;

int shift;
int i;
int loopbegin;
double sum[];
int length;
double lengthvar;
double tmp ;
double wt[];
int c;

//+------------------------------------------------------------------+
//| Custom indicator initialization function                         |
//+------------------------------------------------------------------+
int init()
  {
//---- 2 additional buffers are used for counting.
   IndicatorBuffers(5);

//---- drawing settings
   SetIndexBuffer(2,ExtMapBuffer1);
   SetIndexBuffer(1,ExtMapBuffer2);
   SetIndexBuffer(0,ExtMapBuffer3);
   SetIndexBuffer(3,sum);
   SetIndexBuffer(4,wt);

   SetIndexStyle(2, DRAW_LINE, STYLE_SOLID, 2);
   SetIndexStyle(1, DRAW_LINE, STYLE_SOLID, 2);
   SetIndexStyle(0, DRAW_LINE, STYLE_SOLID, 2);

//---- initialization done
   return(0);
  }

int start()

  {
      //Draw4HowLong = Bars-Rperiod - 5;
      length = Rperiod;
      loopbegin = Draw4HowLong - length - 1;

      for(shift = loopbegin; shift >= 0; shift--)
      {
         sum[1] = 0;
         for(i = length; i >= 1  ; i--)
         {
         lengthvar = length + 1;
         lengthvar /= 3;
         tmp = 0;
         tmp = ( i - lengthvar)*Close[length-i+shift];
         sum[1]+=tmp;
         }
         wt[shift] = sum[1]*6/(length*(length+1));

//========== COLOR CODING ===========================================

       ExtMapBuffer3[shift] = wt[shift]; //red
       ExtMapBuffer2[shift] = wt[shift]; //green
       ExtMapBuffer1[shift] = wt[shift]; //yellow

       //  for(c=loopbegin;c==shift;c++)
       // {
        if (wt[shift+1] > wt[shift])
        {
        ExtMapBuffer2[shift+1] = EMPTY_VALUE;
  // ObjectCreate("smiley_face", OBJ_ARROW, 0, Time[shift], Low[shift]-Point*20);
  // Print("time=  ",Time[shift]);
  // ObjectSet("smiley_face", OBJPROP_ARROWCODE, 242);
  // ObjectSet("smiley_face", OBJPROP_COLOR , Red);
  // ObjectSet("smiley_face", OBJPROP_WIDTH  , 1);
  // ObjectsRedraw();

        //ExtMapBuffer3[shift+1] = EMPTY_VALUE;
        //ExtMapBuffer3[shift+1] = EMPTY_VALUE;

        }
       else if (wt[shift+1] < wt[shift])
        {
        ExtMapBuffer1[shift+1] = EMPTY_VALUE; //-1 red/greem tight
       //ExtMapBuffer3[shift+1] = EMPTY_VALUE;

        }
         else
         {

         ExtMapBuffer1[shift+1]=CLR_NONE;//EMPTY_VALUE;
         ExtMapBuffer2[shift+1]=CLR_NONE;//EMPTY_VALUE;
         }

      }

      return(0);
  }
//+------------------------------------------------------------------+
Comments