LSMA_Dots_v1
Download script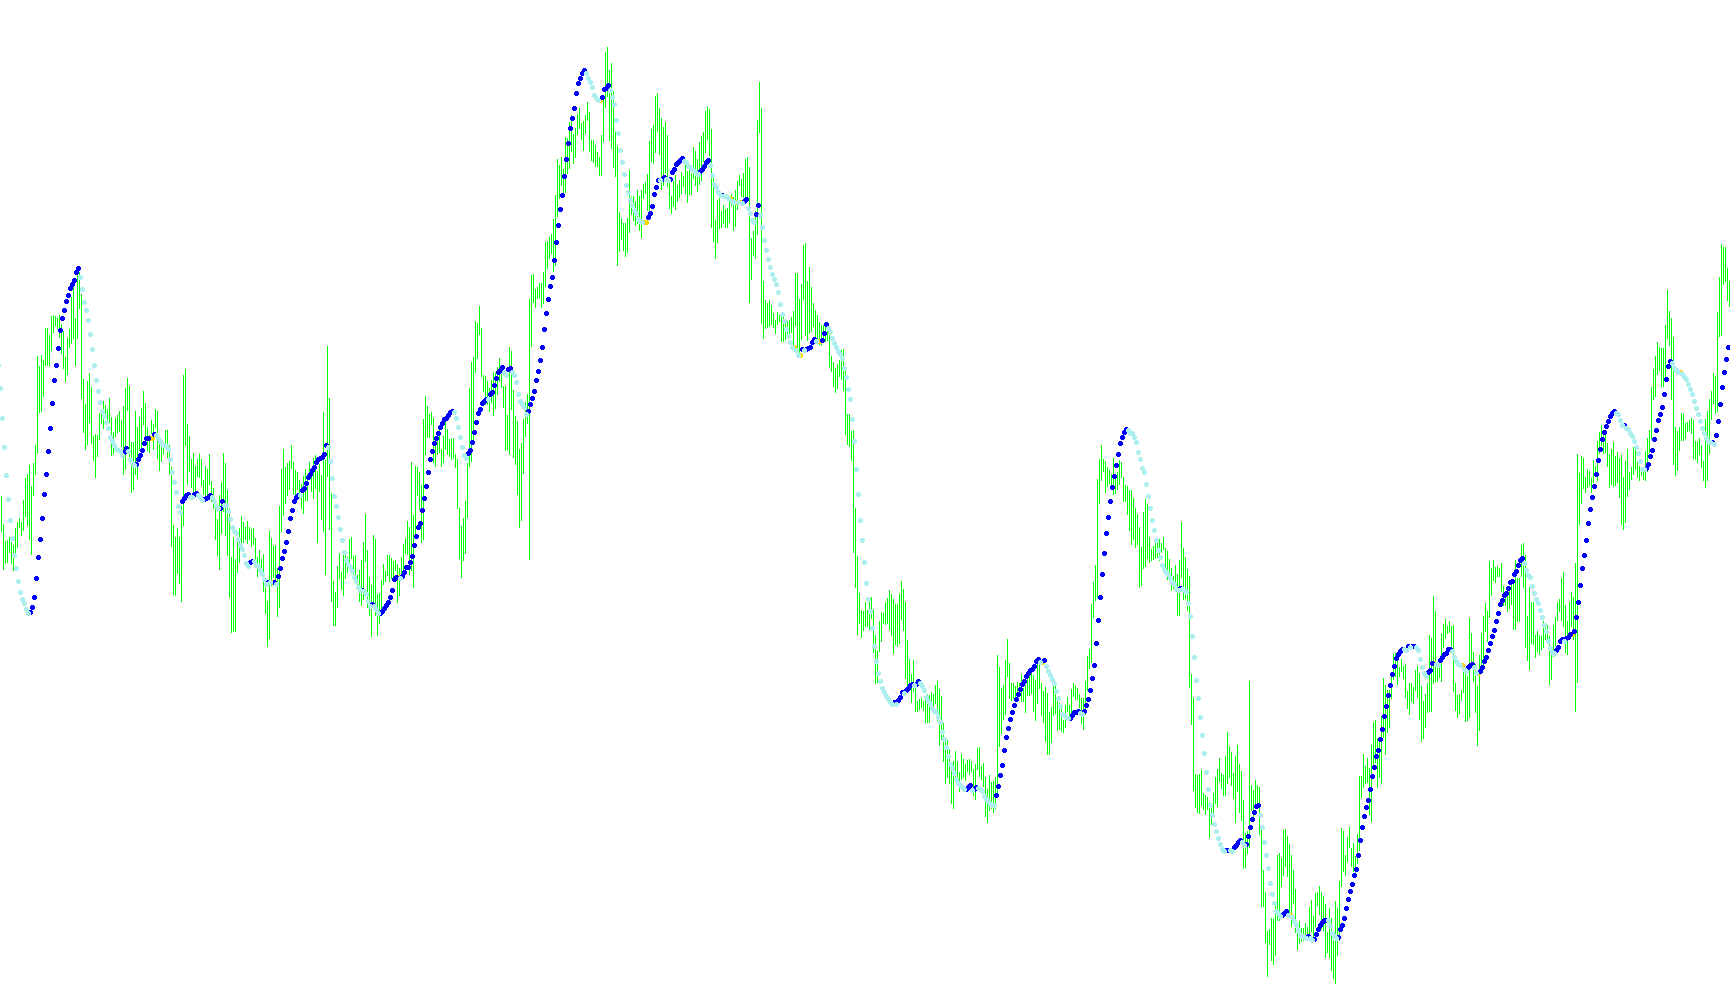
This script functions as a dynamic visual aid for traders, designed to track and highlight price trends directly on a trading chart. Instead of simply showing the raw price of an asset, it calculates a specialized moving average that emphasizes momentum and direction.
How the Logic Works
1. Data Processing and Weighted Calculation The core of this tool lies in how it handles historical price data. Rather than treating every previous price point with equal importance (like a standard simple average), this script applies a specific weighting system. It looks back over a defined period—which can be customized by the user—and performs a mathematical calculation that prioritizes certain price points to determine the current "weight" or trend intensity of the market.
2. Trend Detection Once the tool calculates the weighted value for the current moment, it compares it against the value from the previous candle. By analyzing whether this weight is increasing, decreasing, or remaining stagnant, the script identifies the immediate "mood" of the market:
- Upward Momentum: If the current weighted value is higher than the previous one, the tool identifies a bullish trend.
- Downward Momentum: If the current weighted value is lower than the previous one, it identifies a bearish trend.
- Neutrality: If there is no change between the two points, it indicates a period of consolidation or stability.
3. Visual Representation To make this information easy for a trader to read at a glance, the script converts these calculations into visual markers on the chart. It uses three distinct colors and arrow symbols to represent the market state:
- Red Markers: Signal a downward movement or bearish pressure.
- Green Markers: Signal an upward movement or bullish pressure.
- Yellow Markers: Signal a neutral state where the trend is neither rising nor falling significantly.
Summary for the User
Essentially, this tool acts as a "trend filter." It cleans up the noise of raw price fluctuations and provides you with colored signals that tell you whether the market momentum is currently leaning upward, downward, or moving sideways based on a weighted analysis of recent price history.
//+------------------------------------------------------------------+
//|                      Copyright © 2004, MetaQuotes Software Corp. |
//|                                       http://www.metaquotes.net/ |
//+------------------------------------------------------------------+

#property copyright "Copyright © 2004, MetaQuotes Software Corp."
#property link "http://www.metaquotes.net"
#property indicator_chart_window
#property indicator_buffers 3
#property indicator_color1 Yellow
#property indicator_color2 Green
#property indicator_color3 Red
#property indicator_width1 2
#property indicator_width2 2
#property indicator_width3 2

double ExtMapBuffer1[];
double ExtMapBuffer2[];
double ExtMapBuffer3[];

extern int Rperiod = 34;

int width;
int Draw4HowLong;
int shift;
int i;
int loopbegin;
int length;

double lengthvar;
double tmp;
double sum;
double wt[];

//+------------------------------------------------------------------+
//| Custom indicator initialization function |
//+------------------------------------------------------------------+

int init()
{
	IndicatorBuffers(4);

	SetIndexBuffer(2,ExtMapBuffer1);
	SetIndexBuffer(1,ExtMapBuffer2);
	SetIndexBuffer(0,ExtMapBuffer3);
	SetIndexBuffer(3,wt);


	// Start line => dot changes


	SetIndexStyle(0,DRAW_ARROW);
	SetIndexStyle(1,DRAW_ARROW);
	SetIndexStyle(2,DRAW_ARROW);

	SetIndexArrow(0,159);
	SetIndexArrow(1,159);
	SetIndexArrow(2,159);

	SetIndexLabel(0,"MAnone");
	SetIndexLabel(1,"MAup");
	SetIndexLabel(2,"MAdown");

	// End line => dot changes, Start old code:

/*
	SetIndexStyle(2,DRAW_LINE,STYLE_SOLID);
	SetIndexStyle(1,DRAW_LINE,STYLE_SOLID);
	SetIndexStyle(0,DRAW_LINE,STYLE_SOLID);
*/

	// End old code

	return(0);
}

int start()
{
	Draw4HowLong = Bars - Rperiod - 5;
	length = Rperiod;
	loopbegin = Draw4HowLong - length - 1;

	for(shift = loopbegin; shift >= 1; shift--)
	{
		sum = 0;
		for(i = length; i >= 1 ; i--)
		{
			lengthvar = length + 1;
			lengthvar /= 3;
			tmp = 0;
			tmp = ( i - lengthvar)*Close[length-i+shift];
			sum+=tmp;
		}
		wt[shift] = MathFloor(sum*6/(length*(length+1))/Point)*Point;


		if (wt[shift+1] > wt[shift])
		{
		ExtMapBuffer1[shift] = wt[shift]; //red
		}
		else if (wt[shift+1] < wt[shift])
		{
		ExtMapBuffer2[shift] = wt[shift]; //green
		}
		else
		{
		ExtMapBuffer3[shift] = wt[shift]; //yellow
		}
	}

	return(0);
}
Comments