Laguerre RSI
Download script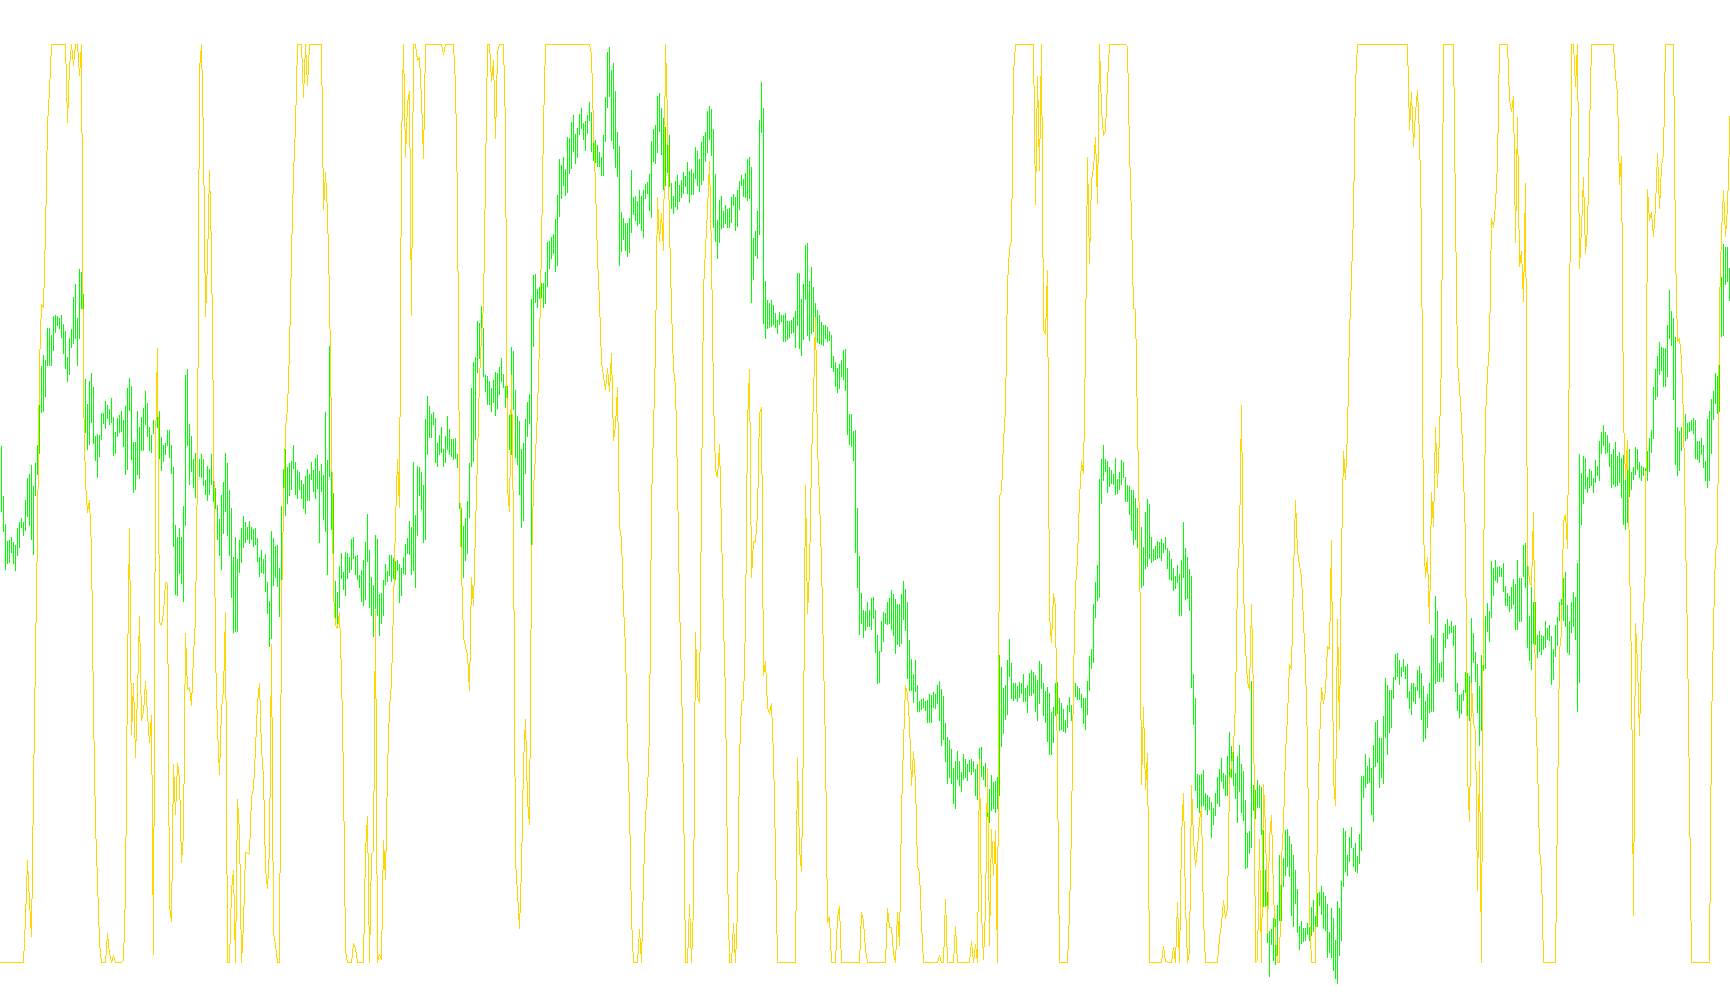
The Laguerre RSI is a specialized technical analysis tool designed to help traders understand the momentum and "speed" of price movements. Unlike standard oscillators that can sometimes be noisy or lag behind current market action, this specific script uses a mathematical approach to smooth out price data while remaining highly responsive to new information.
How the Logic Works
The script processes market data through three primary stages:
1. The Smoothing Layer (Laguerre Filtering) Instead of looking at raw price jumps, the tool first passes the closing prices through a series of four mathematical filters (labeled as L0 through L3). These filters act like a sophisticated set of weights; they look at the current price and compare it to previous values using a specific sensitivity setting (known as "Gamma"). This creates a stabilized representation of the market trend, effectively filtering out minor "jitter" while preserving the overall direction.
2. Momentum Calculation Once the data is smoothed, the script compares these filtered values against one another in pairs. It looks for the "gap" or difference between each successive level of the filter.
- If the value is increasing, it captures that upward movement.
- If the value is decreasing, it captures that downward movement.
By comparing these differences, the script determines how much force is behind the current price move compared to the preceding moves.
3. The Final RSI Output The final step converts these movements into a single percentage-based line. The result is an oscillator that fluctuates between 0 and 1 (or 0% and 100%).
How to Interpret the Results
The goal of this logic is to provide a clearer picture of "overbought" or "oversold" conditions:
- High Values: When the line moves toward the top of the scale, it indicates strong upward momentum.
- Low Values: When the line moves toward the bottom, it indicates strong downward momentum.
- Stability: Because of the Laguerre filtering, the line should appear smoother than a standard RSI, helping traders identify sustained trends rather than reacting to every minor price tick.
In short, this script acts as a "momentum thermometer," telling you not just where the price is, but how much energy is currently driving it in a specific direction.
//+------------------------------------------------------------------+
//|                                                 Laguerre RSI.mq4 |
//|                                Copyright © 2005, David W. Thomas |
//|                                           mailto:davidwt@usa.net |
//+------------------------------------------------------------------+
// based on http://www.mesasoftware.com/TimeWarp.doc.
#property copyright "Copyright © 2005, David W. Thomas"
#property link      "mailto:davidwt@usa.net"

#property indicator_separate_window
#property indicator_level2 0.75
#property indicator_level3 0.45
#property indicator_level4 0.15
#property indicator_minimum 0
#property indicator_maximum 1
#property indicator_buffers 1
#property indicator_color1 MediumPurple

//---- input parameters
extern double    gamma=0.7;

//---- buffers
double RSI[];
double L0[];
double L1[];
double L2[];
double L3[];

//+------------------------------------------------------------------+
//| Custom indicator initialization function                         |
//+------------------------------------------------------------------+
int init()
{
   IndicatorBuffers(5);
//---- indicators
   SetIndexStyle(0, DRAW_LINE);
   SetIndexDrawBegin(0, 1);
	SetIndexLabel(0, "Laguerre RSI");
	SetIndexEmptyValue(0, -0.01);
   SetIndexBuffer(0, RSI);
   SetIndexBuffer(1, L0);
   SetIndexBuffer(2, L1);
   SetIndexBuffer(3, L2);
   SetIndexBuffer(4, L3);
//----
   string short_name="LaguerreRSI(" + DoubleToStr(gamma, 2) + ")";
   IndicatorShortName(short_name);
   return(0);
}

//+------------------------------------------------------------------+
//| Custor indicator deinitialization function                       |
//+------------------------------------------------------------------+
int deinit()
{
   return(0);
}

//+------------------------------------------------------------------+
//| Custom indicator iteration function                              |
//+------------------------------------------------------------------+
int start()
{
	int    limit;
	int    counted_bars = IndicatorCounted();
	double CU, CD;
	//---- last counted bar will be recounted
	if (counted_bars>0)
		counted_bars--;
	else
		counted_bars = 1;
	limit = Bars - counted_bars;
	//---- computations for RSI
	for (int i=limit; i>=0; i--)
	{
		L0[i] = (1.0 - gamma)*Close[i] + gamma*L0[i+1];
		L1[i] = -gamma*L0[i] + L0[i+1] + gamma*L1[i+1];
		L2[i] = -gamma*L1[i] + L1[i+1] + gamma*L2[i+1];
		L3[i] = -gamma*L2[i] + L2[i+1] + gamma*L3[i+1];
		//Print(i," Close[i]=",Close[i],", (1.0 - gamma)*Close[i]=",(1.0 - gamma)*Close[i],", gamma*L0[i+1]=",gamma*L0[i+1]);
		//Print(i," L0=",L0[i],",L1=",L1[i],",L2=",L2[i],",L3=",L3[i]);

		CU = 0;
		CD = 0;
		if (L0[i] >= L1[i])
			CU = L0[i] - L1[i];
		else
			CD = L1[i] - L0[i];
		if (L1[i] >= L2[i])
			CU = CU + L1[i] - L2[i];
		else
			CD = CD + L2[i] - L1[i];
		if (L2[i] >= L3[i])
			CU = CU + L2[i] - L3[i];
		else
			CD = CD + L3[i] - L2[i];

		if (CU + CD != 0)
			RSI[i] = CU / (CU + CD);
	}
   return(0);
}
//+------------------------------------------------------------------+
Comments