Ahoora(chart)
Download script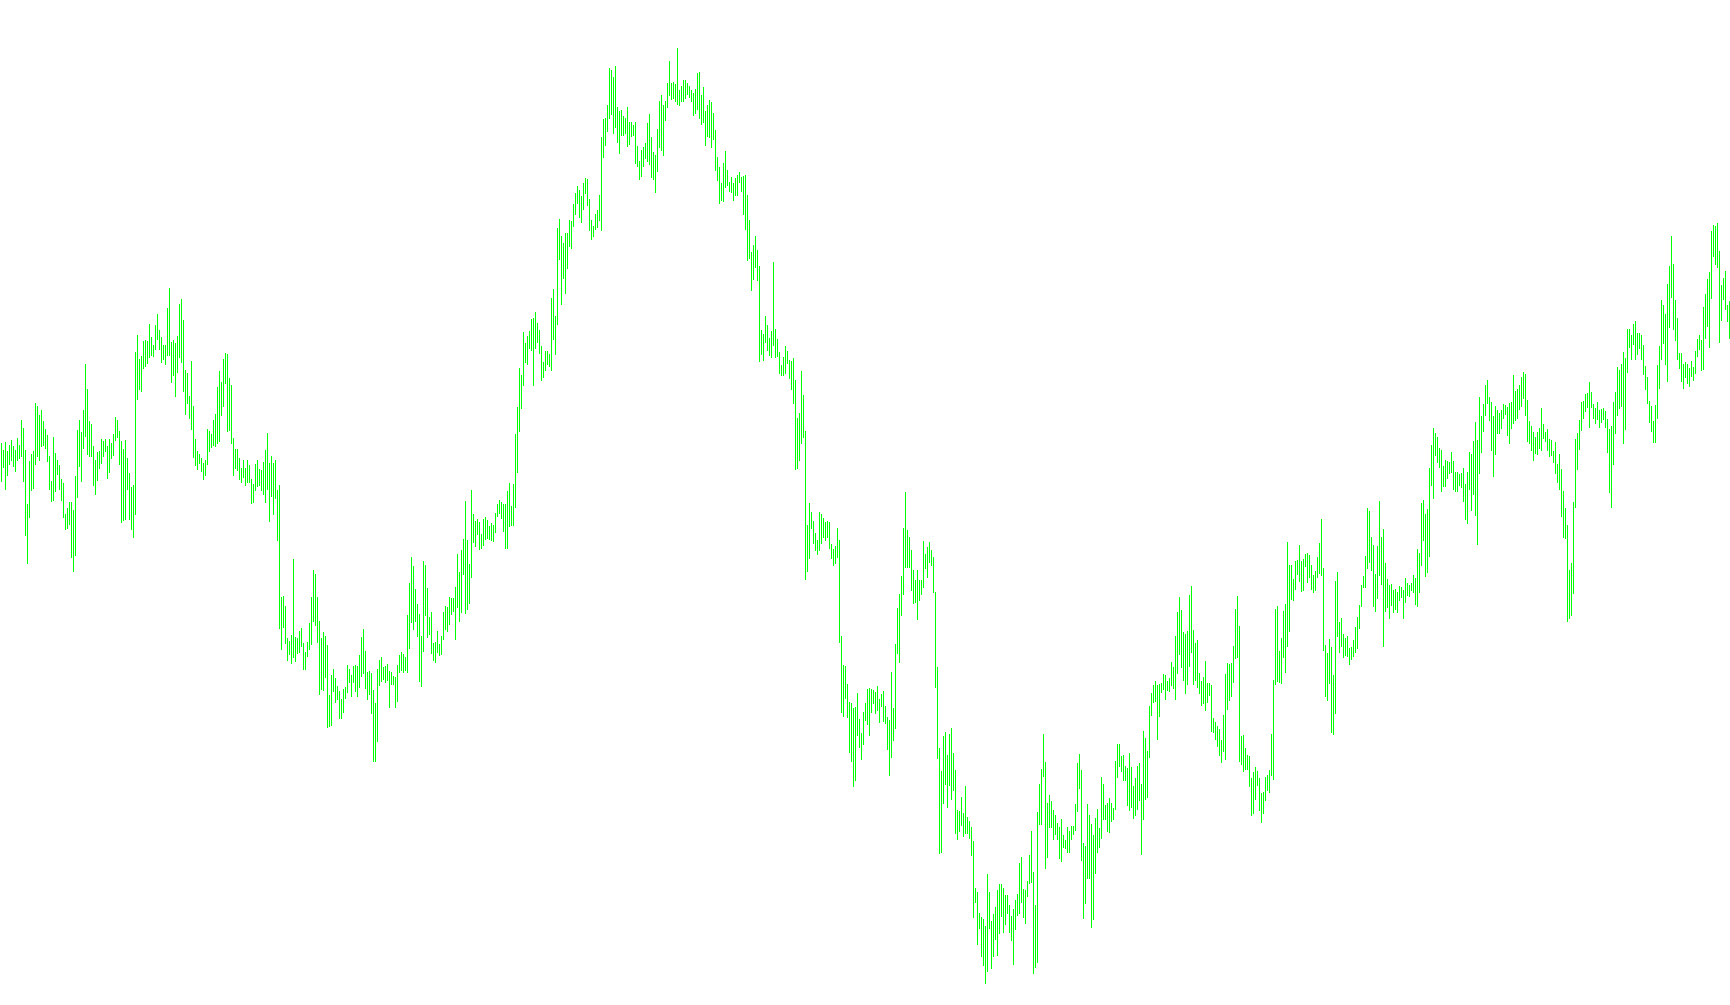
This script functions as a visual trading tool designed to identify market trends and potential entry levels by analyzing price action relative to moving averages and volatility. It works by processing historical data to separate "upward" momentum from "downward" momentum on your chart.
Core Logic and Mechanics
The script operates through a multi-step calculation process to determine how the market is behaving at any given moment:
1. Trend Detection The tool first establishes the current direction of the market. It does this by comparing the high and low prices of candles against specific Moving Averages (MA).
- If the price remains above a certain average level, the script registers an upward trend.
- If the price falls below a corresponding average level, it identifies a downward trend.
2. Dynamic Price Level Calculation Once the trend is identified, the script calculates specific price targets or "value" lines based on market volatility (using the Average True Range).
- In an upward trend, it adds the volatility factor to the moving average of the low prices.
- In a downward trend, it subtracts the volatility factor from the moving average of the high prices.
This ensures that the lines shown on your chart are not static; they expand and contract based on how much the market is actually moving.
3. Smoothing and Filtering To ensure the data is reliable, the script applies a Relative Strength Index (RSI) calculation to the values it has generated. This helps smooth out minor market "noise" and provides a cleaner visual representation of the trend's strength.
Visual Representation on Chart
The indicator displays this information through three distinct components:
- Upward Momentum Line: A lime-colored line that appears only when the script detects a bullish trend. It represents the calculated price level for potential buying interest or trend confirmation.
- Downward Momentum Line: A red-colored line that appears only during bearish trends, representing the calculated price levels for selling interest.
- Reference Levels: The chart includes several horizontal levels (ranging from 10 to 90) to act as guides for identifying overextended price action or significant zones of interest.
In summary, this tool filters out general market movements to show you the "active" trend lines, automatically switching between bullish and bearish values based on whether the current price is breaking above or below key moving averages.
//+------------------------------------------------------------------+
//| Ahoora.mq4.mq4
//| Copyright © 2010, Farshad Saremifar, Farshad.saremifar@gmail.com
//| Farshad.saremifar@gmail.com
//+------------------------------------------------------------------+
#property copyright "Copyright © 2010, Farshad Saremifar, Farshad.saremifar@gmail.com"
#property link      "Farshad.saremifar@gmail.com"

#property indicator_chart_window

#property indicator_buffers 3
#property indicator_color1 Lime
#property indicator_color2 Red
#property indicator_color3 Khaki

#property indicator_width1 3
#property indicator_width2 3
#property indicator_width3 1

#property indicator_style3 STYLE_DASHDOTDOT
#property indicator_level1 10
#property indicator_level2 20
#property indicator_level3 30
#property indicator_level4 50
#property indicator_level5 70
#property indicator_level6 80
#property indicator_level7 90
extern string Copyright="Version 1.1 :Farshad Saremifar";
extern int Lookback = 25;
extern int ma_method=1;
 bool FillHole=true;
double up[];
double down[];
double Up[];
double buffer[];
double value[];
double value2[];
double value3[];
//+------------------------------------------------------------------+
//| Custom indicator initialization function                         |
//+------------------------------------------------------------------+
int init()
  {
//---- indicators
IndicatorBuffers(5);
SetIndexBuffer(0, up);
SetIndexStyle(0, DRAW_LINE);
SetIndexBuffer(1, down);
SetIndexStyle(1, DRAW_LINE);
SetIndexBuffer(2, value);
SetIndexStyle(2, DRAW_LINE);
 SetIndexDrawBegin(2,Lookback);
SetIndexBuffer(3, value2);
SetIndexStyle(3, DRAW_NONE);
//SetIndexEmptyValue(3,0.0);
//SetIndexEmptyValue(2,0.0);
SetIndexBuffer(4, buffer);
    SetIndexEmptyValue( 0, EMPTY_VALUE );
   SetIndexEmptyValue( 1, EMPTY_VALUE );
 SetIndexDrawBegin(0,Lookback);
 SetIndexDrawBegin(1,Lookback);
 SetIndexDrawBegin(3,Lookback);
 SetIndexDrawBegin(4,Lookback);

   IndicatorShortName("Ahoora Version 1.1:By farshad saremifar " );


//----
   return(0);
  }
//+------------------------------------------------------------------+
//| Custom indicator deinitialization function                       |
//+------------------------------------------------------------------+
int deinit()
  {
//----

//----
   return(0);
  }
//+------------------------------------------------------------------+
//| Custom indicator iteration function                              |
//+------------------------------------------------------------------+
int start()
  {


 int bars;
   int    counted_bars=IndicatorCounted();


   if (counted_bars < 0) return (-1);
   if (counted_bars > 0) counted_bars--;
   //if (FillHole) bars = Bars-counted_bars;
    bars = Bars-counted_bars;

//----
   for (int i = bars-1; i >= 0; i--) {
     // buffer[i] = buffer[i + 1];
     // value[i]=value[i+1];
      RefreshRates();
      if (High[i] > iMA(Symbol(), 0, Lookback, 0, ma_method, PRICE_HIGH, i )) buffer[i] = 1;
      if (Low[i] < iMA(Symbol(), 0, Lookback, 0, ma_method, PRICE_LOW, i)) buffer[i] = -1;


   }
for ( i = bars-1; i >= 0; i--) {
 if (buffer[i] < 0) {
     value[i]=iMA(Symbol(), 0, Lookback, 0, ma_method, PRICE_HIGH, i)-iATR(Symbol(),0,Lookback,i);

     } else {

      value[i]=iATR(Symbol(),0,Lookback,i)+iMA(Symbol(), 0, Lookback, 0, ma_method, PRICE_LOW, i );
     }
  }
//----
int j=0;
if (FillHole) j=1;
   else j = 0;

for ( i = bars-1; i >= 0; i--)
{

value2[i]=iRSIOnArray(value,0,Lookback,i);


 }
for ( i = bars; i >= 0; i--)
{
  if (buffer[i] < 0) {
         down[i] = value[i];
         up[i] = EMPTY_VALUE;
      } else if (buffer[i] > 0){
         down[i] =EMPTY_VALUE;
         up[i] = value[i];
      }

}
   return(0);
  }
//+------------------------------------------------------------------+
Comments