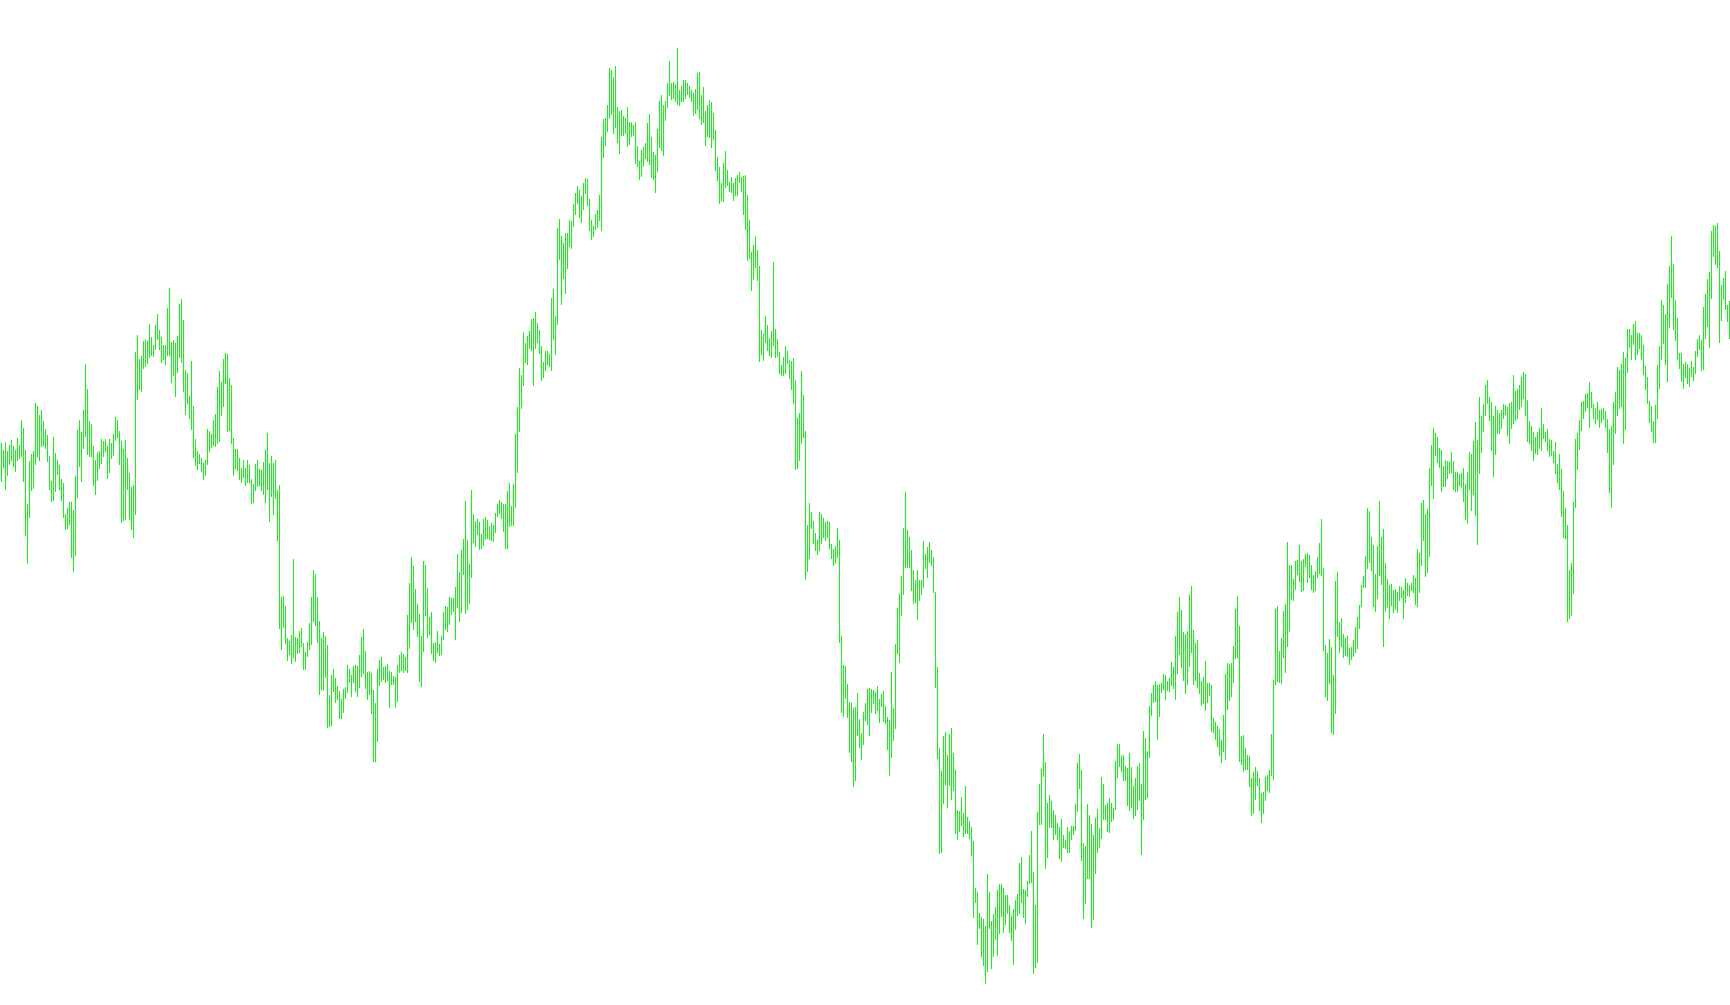
The BBStopLight indicator is a technical analysis tool designed to help traders identify specific market conditions by measuring the relationship between price volatility and the average price. Instead of showing complex numbers, it translates this data into a visual "Stoplight" system, helping you determine when the market is providing active opportunities and when it is best to stay on the sidelines.
How the Logic Works
The core of this script revolves around calculating the Bollinger Band Width Ratio. Here is a step-by-step breakdown of the logic:
1. Calculating Market Movement The tool first calculates a baseline (a moving average) of the price over a specific period. It then measures the "Standard Deviation"—which is essentially a calculation of how much the current price is swinging away from that average. By comparing these two values, the script determines the intensity of the market's movement.
2. Determining the Ratio The script creates a custom ratio based on the distance between the upper and lower boundaries of the market's movement compared to the average price. This ratio acts as a "momentum gauge," showing whether the market is expanding (becoming more volatile) or contracting (becoming quieter).
3. The Stoplight Signaling System The most important feature for the user is how the script interprets these ratios into three distinct visual states:
- Active Trend (Dark Orange): When the volatility ratio is increasing compared to the previous period, the indicator signals an active move. This suggests that the market momentum is building, identifying a potential window for trading activity.
- Exhaustion Phase (Pink): When the volatility ratio begins to decrease after a period of growth, the indicator changes color. This logic suggests that the "run" may be over or losing steam, signaling that the current move might be reaching its limit.
- Inactive Zone (Black): The script also monitors for negative values or specific lack of momentum. When these conditions are met, it signals a "no trading" zone where the market lacks the necessary characteristics for the strategy to be effective.
Summary for the Trader
Essentially, this tool filters out the "noise" of the market. It looks at how hard the price is pushing compared to its recent history and gives you a visual cue: Orange means the move has strength, Pink means the move is cooling off, and Black means the market is not currently providing a viable setup based on this specific volatility logic.
/*-----------------------------+
|			       |
| Shared by www.Aptrafx.com    |
|			       |
+------------------------------*/

//+------------------------------------------------------------------+
//|                                              BBStopLight.mq4     |
//|                           based on BBandWidthRatio.mq4 from Maji |
//|                                -- adapted by Gideon, August 2006 |
//+------------------------------------------------------------------+
#property copyright "BBStopLight"
#property link      "gideon@smolders.biz"

#property indicator_separate_window
#property indicator_buffers 4
#property indicator_color1 SlateGray
#property indicator_color2 DarkOrange // trading allowed
#property indicator_color3 Pink // run is over, no trading
#property indicator_color4 Black // no trading allowed


//---- input parameters
extern int       BB_Period=20;
extern double    Deviation=2.0;
extern double    Multiply=2000;
extern double    Zeroline=3;

double buf1[];
double buf2[];
double buf3[];
double buf4[];


//+------------------------------------------------------------------+
//| Custom indicator initialization function                         |
//+------------------------------------------------------------------+
int init()
  {
   SetIndexStyle(0, DRAW_NONE, 1, 2);
   IndicatorDigits(MarketInfo(Symbol(), MODE_DIGITS));
   SetIndexDrawBegin(0,BB_Period);
   SetIndexLabel(0,"BBandWidthRatio");
   SetIndexBuffer(0, buf1);

   SetIndexStyle(1, DRAW_HISTOGRAM, 1, 2);
   IndicatorDigits(MarketInfo(Symbol(), MODE_DIGITS));
   SetIndexDrawBegin(1,BB_Period);
   SetIndexLabel(1,"BBandWidthRatio");
   SetIndexBuffer(1, buf2);

   SetIndexStyle(2, DRAW_HISTOGRAM, 1, 2);
   IndicatorDigits(MarketInfo(Symbol(), MODE_DIGITS));
   SetIndexDrawBegin(2,BB_Period);
   SetIndexLabel(2,"BBandWidthRatio");
   SetIndexBuffer(2, buf3);

   SetIndexStyle(3, DRAW_HISTOGRAM, 1, 2);
   IndicatorDigits(MarketInfo(Symbol(), MODE_DIGITS));
   SetIndexDrawBegin(3,BB_Period);
   SetIndexLabel(3,"BBandWidthRatio");
   SetIndexBuffer(3, buf4);
   return(0);
  }
//+------------------------------------------------------------------+
//| Custom indicator deinitialization function                       |
//+------------------------------------------------------------------+
int deinit()
  {
//----

//----
   return(0);
  }
//+------------------------------------------------------------------+
//| Custom indicator iteration function                              |
//+------------------------------------------------------------------+
int start()
  {
   int i, j;
   double ave, sko, sum;
   int counted_bars=IndicatorCounted();
   double MA, Up, Dn;

   if(Bars<=BB_Period) return(0);

   i=Bars-BB_Period;
   if(counted_bars>BB_Period) i=Bars-counted_bars-1;


   if (Bars<=BB_Period) return;

   for (i=Bars-BB_Period; i>=0; i--)
   {

    MA = iMA(NULL,0,BB_Period,0,MODE_LWMA,PRICE_OPEN,i);
    sum = 0;
    for (j=0; j<BB_Period; j++) sum+=Close[i+j];
    ave = sum / BB_Period;
    sum = 0;
    for (j=0; j<BB_Period; j++) sum+=(Close[i+j]-ave)*(Close[i+j]-ave);
    sko = MathSqrt(sum / BB_Period);

    Up = MA+(Deviation*sko);
    Dn = MA-(Deviation*sko);

    buf1[i] = (Multiply*(Deviation*sko)/MA);

    if (buf1[i]>0 && buf1[i]>buf1[i+1]) {
    buf2[i] = buf1[i];
    buf3[i] = 0;
    buf4[i] = 0;
    }
    if (buf1[i]>0 && buf1[i]<buf1[i+1]) {
    buf2[i] = 0;
    buf3[i] = buf1[i];
    buf4[i] = 0;
    }
    if (buf1[i]<0) {
    buf2[i] = 0;
    buf3[i] = 0;
    buf4[i] = buf1[i];
    }

   }

    return(0);

  }
//+------------------------------------------------------------------+
Comments