#_i_FFT_separate_Close2_W_D_diff_001
Download script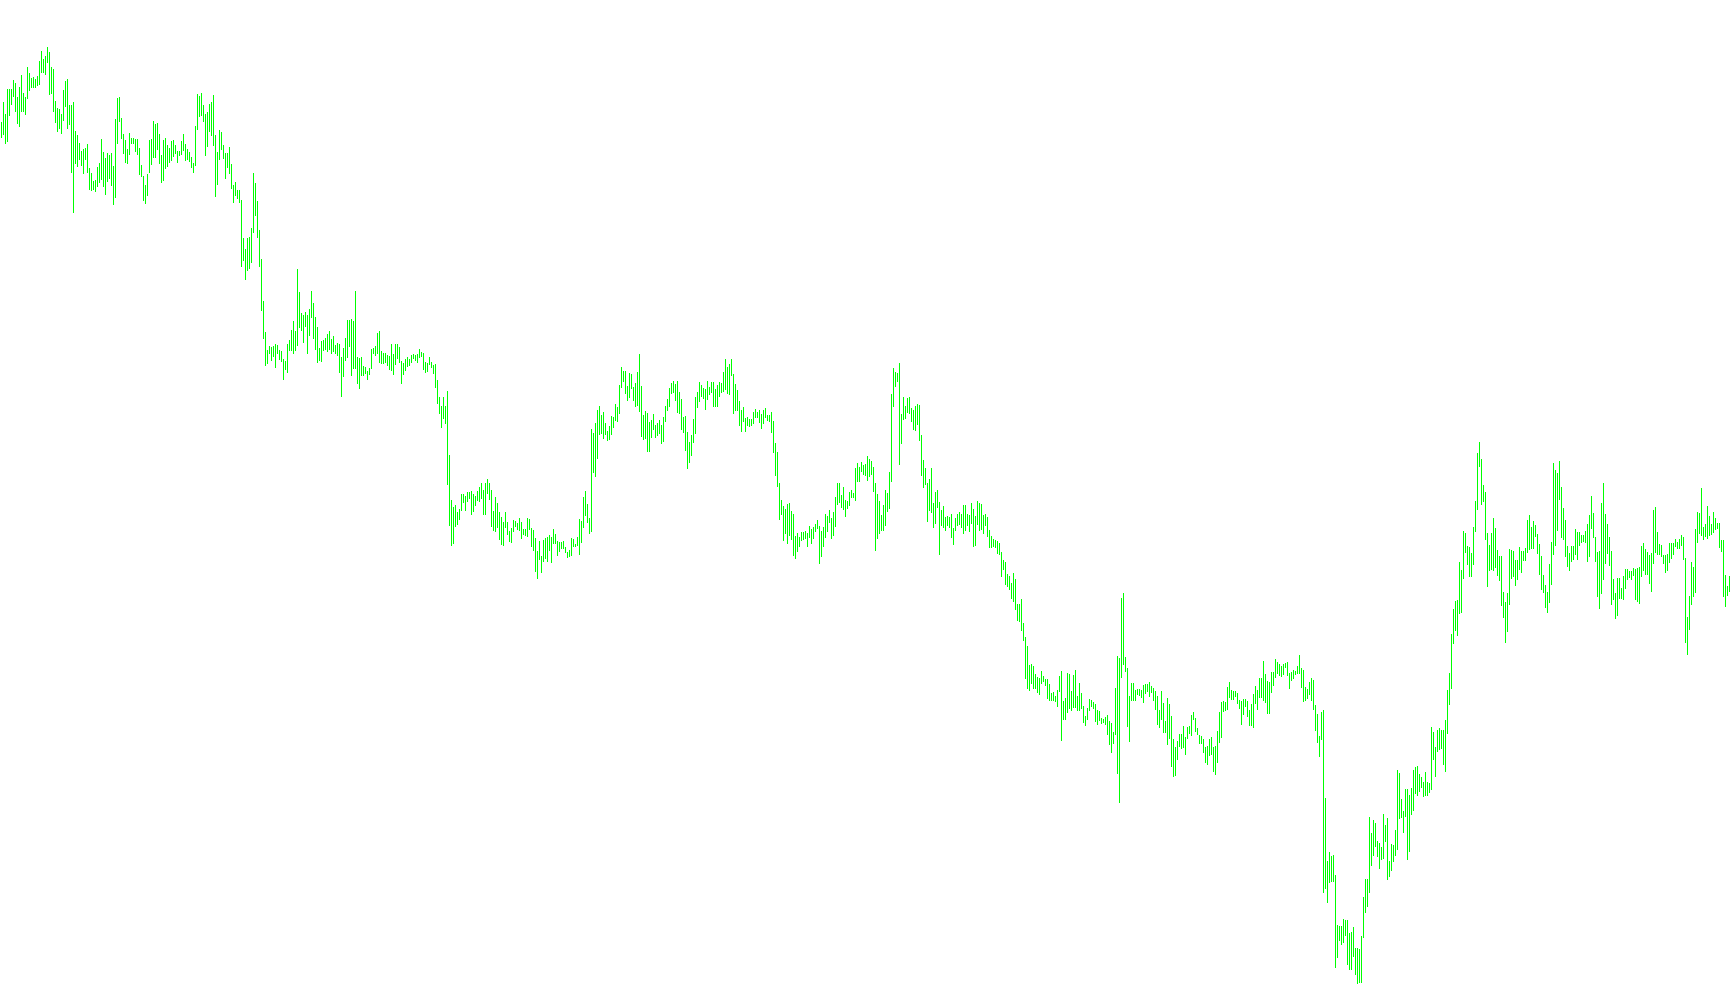
This script functions as a sophisticated technical analysis tool designed to break down market price movements into their core underlying frequencies. Rather than simply looking at the "noise" of price action, it employs advanced mathematical principles to identify and isolate specific cycles within the financial data.
How the Logic Works
1. Data Collection and Synchronization The tool begins by capturing two distinct sets of historical closing prices from the market. It takes one set of current price data and a second set shifted slightly forward in time. By comparing these two points in time, the script creates a foundation for measuring how price momentum evolves across different intervals.
2. Frequency Transformation (Fourier Analysis) The core "engine" of this script is a mathematical process that converts time-based price movements into frequency data. In simple terms, it takes a complex, jagged chart and identifies the rhythmic "pulses" or waves that compose it. It separates these movements so the user can see which cycles are dominant and which are merely insignificant background noise.
3. Targeted Filtering Not all market frequencies are useful for trading. The script includes a specific filtering mechanism (defined by minimum and maximum boundaries) that allows it to ignore certain types of "noise." By isolating a specific range of frequencies, the tool focuses only on the data points that represent meaningful price cycles, effectively cleaning the signal for clearer interpretation.
4. Re-construction and Comparison Once the frequencies are isolated and filtered, the script performs an inverse calculation. This reconstructs the cleaned data back into a readable format. Finally, it calculates the difference between the two original price sets (the current and the shifted sets).
Visual Output
The results are displayed in a separate window on your chart as three distinct visual elements:
- Histograms: These represent the magnitude of the difference between the processed price signals. They provide a visual cue of the strength and direction of the underlying cycle movements.
- Line Plot: This provides a continuous view of the difference between the two datasets, helping to visualize the "gap" or trend formed by the filtered frequencies.
Essentially, this tool allows a trader to see "under the hood" of the price action, filtering out distractions to reveal the underlying rhythmic patterns of the market.
//+------------------------------------------------------------------+
//|                                            #_i_SpecktrAnalis.mq4 |
//|                                          Copyright © 2006, klot. |
//|                                                     klot@mail.ru |
//+------------------------------------------------------------------+
#property copyright "Copyright © 2006, klot."
#property link      "klot@mail.ru"


#import "#_lib_FFT.ex4"
void realfastfouriertransform(double& a[], int tnn, bool inversefft);
#import

#property indicator_separate_window
#property indicator_buffers 3
#property indicator_color1 Red
#property indicator_color2 Blue
#property indicator_color3 Yellow
#property indicator_level1 0.0
//#property indicator_level1 0.0
//#property indicator_level1 0.0
//---- buffers
double Buffer1[];
double Buffer2[];
double Buffer3[];
//---
extern int n=7; // Äëèíà ðÿäà
extern int Fmin=2;//80;//2; // Ãðíèöà Ôèëüòðà ïî Í×.
extern int Fmax=60;//128; // Ãðàíèöà Ôèëüòðà ïî Â×.
//extern string sym="GBPUSD";
extern int shift=6;//extern string sym="EURUSD";

double aa[];
double bb[];
int N;

//+------------------------------------------------------------------+
//| Custom indicator initialization function                         |
//+------------------------------------------------------------------+
int init()
  {
//---- indicators
SetIndexStyle(0,DRAW_HISTOGRAM,0,2);
SetIndexBuffer(0,Buffer1);
SetIndexEmptyValue(0,0);
SetIndexStyle(1,DRAW_HISTOGRAM,0,2);
SetIndexBuffer(1,Buffer2);
SetIndexEmptyValue(1,0);
SetIndexStyle(2,DRAW_LINE,0,2);
SetIndexBuffer(2,Buffer3);
SetIndexEmptyValue(2,0);

//---
   N=MathPow(2,n);
   ArrayResize(aa,N);
   ArrayResize(bb,N);

if( Fmax>=N ) Fmax=N;
if( Fmin<=2 ) Fmin=2;

//----
   return(0);
  }
//+------------------------------------------------------------------+
//| Custom indicator deinitialization function                       |
//+------------------------------------------------------------------+
int deinit()
  {
//----

//----
   return(0);
  }
//+------------------------------------------------------------------+
//| Custom indicator iteration function                              |
//+------------------------------------------------------------------+
int start()
  {

   if( Bars<N+shift) return(0);

   //---
   for(int i=N-1; i>=0; i--)
   {
     aa[i]=iClose(Symbol(),0,i);
     bb[i]=iClose(Symbol(),0,i+shift);
   }
   //---
   realfastfouriertransform(aa, N, false);
   realfastfouriertransform(bb, N, false);
   //---
   N=ArraySize(aa);
   //Comment("n= ",N);
   //---
   for( i=0; i<=N-1; i++)
   {
      if( i<Fmin || i>Fmax) { aa[i]=0.0;bb[i]=0.0; }
   }
   //---
   realfastfouriertransform(aa, N, true);
   realfastfouriertransform(bb, N, true);
   //---
   SetIndexDrawBegin(0,Bars-N);
   //SetIndexDrawBegin(1,Bars-N-shift);
   SetIndexDrawBegin(1,Bars-N);
   //---
   for( i=0; i<=N-1; i++)
   {
       double diff1=bb[i]-aa[i];
      if (diff1<0)
        Buffer2[i]=-diff1;
      //Buffer2[i+shift]=bb[i];
      else if (diff1>0)
        Buffer1[i]=-diff1;
      Buffer3[i]=-diff1;

   }
   //----
   return(0);
  }
//-------------------------------------------------------------------+
Comments