Heiken_Ashi_Ma no tails
Download script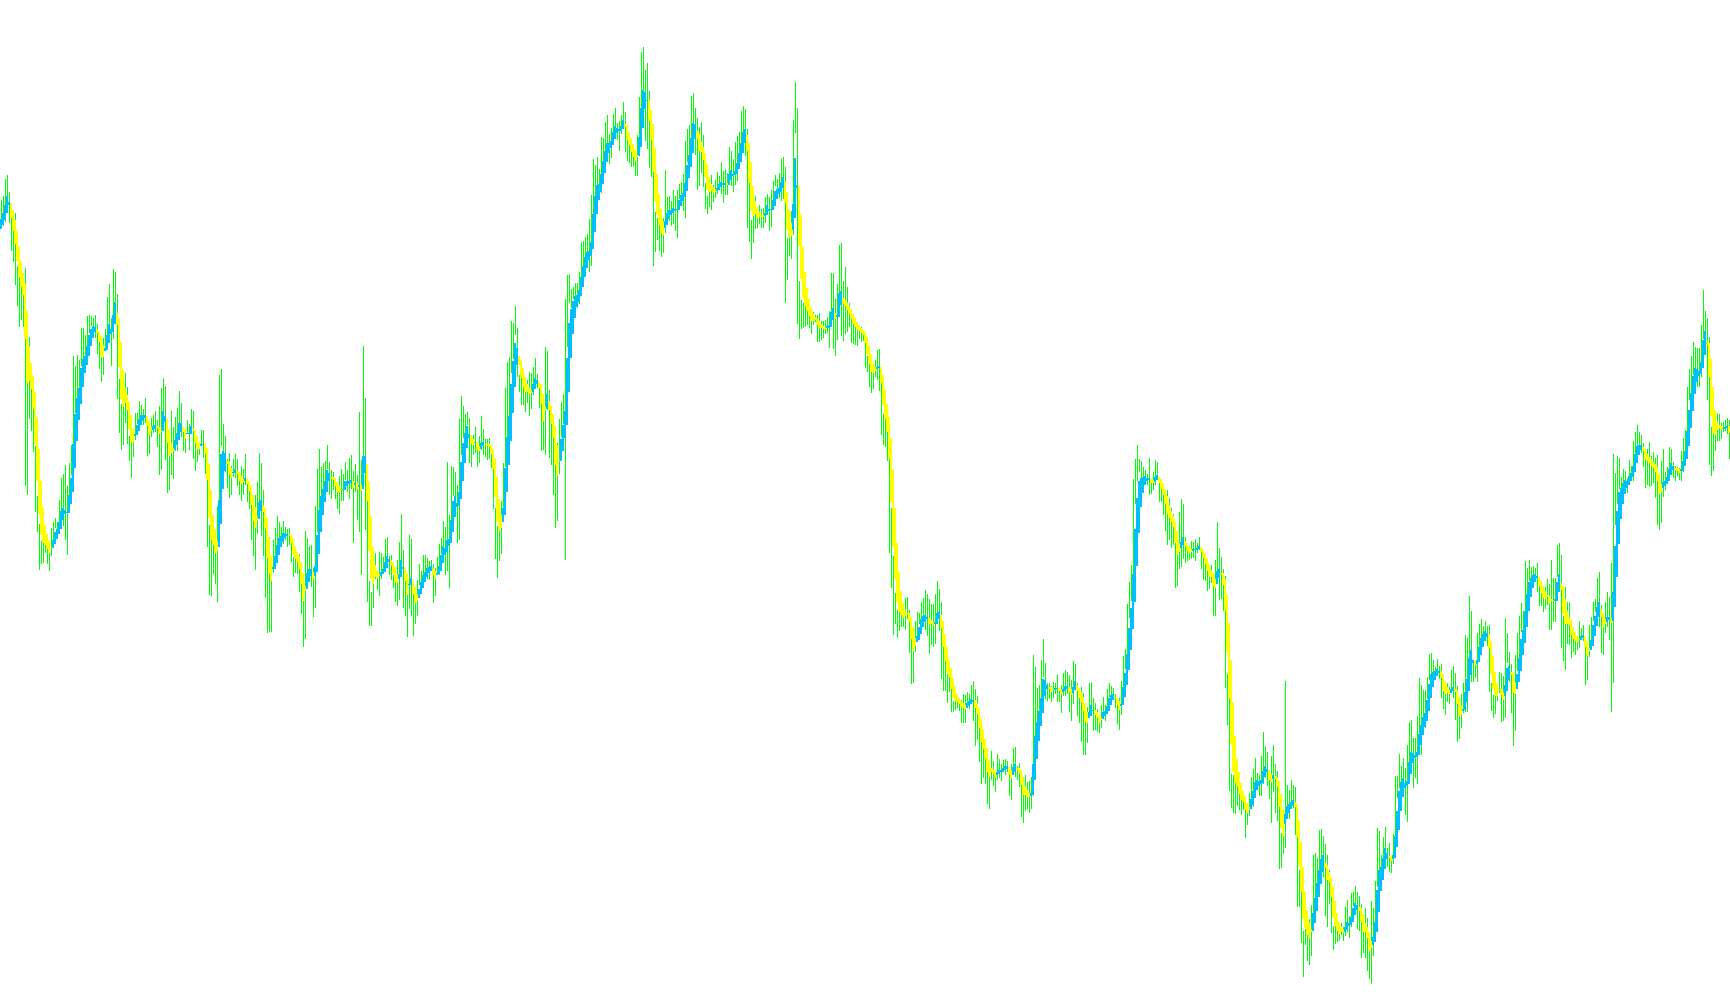
This tool is designed to provide traders with a specialized visual overlay on their price charts, combining two well-known technical analysis concepts: Heiken Ashi candles and Moving Averages.
Core Concept
The primary goal of this script is to "smooth out" the market noise. Standard price action can often be erratic, with sharp spikes and jagged movements that make it difficult to identify the underlying trend. By blending Moving Averages into the Heiken Ashi formula, this indicator creates a more fluid representation of price momentum, helping traders see where the market is heading without being distracted by minor fluctuations.
How the Logic Works
The script processes market data through a three-step mathematical journey:
1. Data Smoothing (The Moving Average Layer) Instead of looking at the raw "High," "Low," "Open," and "Close" prices of a single candle, the script looks back over a specific number of previous bars (defined by the period settings). It calculates the average price for each of these four components. This ensures that the data being used is a reflection of recent history rather than a sudden, one-time price jump.
2. Heiken Ashi Transformation Once the smoothed averages are calculated, the script applies the Heiken Ashi logic. Unlike standard candles, which show exactly what happened in a timeframe, Heiken Ashi candles are designed to show the "average" price movement.
- It calculates a new Opening Price based on the previous candle's data.
- It calculates a new Closing Price by averaging the smoothed highs, lows, opens, and closes of the current period.
3. Visual Representation The final result is displayed as a histogram on your chart. Because it uses both smoothing and the Heiken Ashi formula, the resulting visual shows the "flow" of the market.
What This Means for the User
By using this script, you are looking at a filtered version of the market. It helps in:
- Trend Identification: It makes it easier to see if the market is trending upward or downward by providing more consistent, cohesive candle shapes.
- Noise Reduction: By calculating averages before drawing the bars, it prevents "fake-outs" caused by temporary price spikes.
- Clarity: It provides a cleaner visual environment for making decisions on when to enter or exit a trade based on the prevailing momentum.
//+------------------------------------------------------------------+
//|                                               Heiken Ashi Ma.mq4 |
//+------------------------------------------------------------------+
//|                                                      mod by Raff |
//+------------------------------------------------------------------+
#property copyright "Copyright © 2006, Forex-TSD.com "
#property link      "http://www.forex-tsd.com/"

#property indicator_chart_window
#property indicator_buffers 4
#property indicator_color1 DarkOrange
#property indicator_color2 Turquoise
#property indicator_color3 Yellow
#property indicator_color4 DeepSkyBlue
//---- parameters
extern int MaMetod  = 1;
extern int MaPeriod = 3;
//---- buffers
double ExtMapBuffer1[];
double ExtMapBuffer2[];
double ExtMapBuffer3[];
double ExtMapBuffer4[];
//----
int ExtCountedBars=0;
//+------------------------------------------------------------------+
//| Custom indicator initialization function                         |
//|------------------------------------------------------------------|
int init()
  {
//---- indicators
   SetIndexStyle(0,DRAW_HISTOGRAM, 2, 1, Yellow);
   SetIndexBuffer(0, ExtMapBuffer1);
   SetIndexStyle(1,DRAW_HISTOGRAM, 2, 2, DeepSkyBlue);
   SetIndexBuffer(1, ExtMapBuffer2);
   SetIndexStyle(2,DRAW_HISTOGRAM, 2, 2, Yellow);
   SetIndexBuffer(2, ExtMapBuffer3);
   SetIndexStyle(3,DRAW_HISTOGRAM, 2, 2, DeepSkyBlue);
   SetIndexBuffer(3, ExtMapBuffer4);
//----
   SetIndexDrawBegin(0,5);
//---- indicator buffers mapping
   SetIndexBuffer(0,ExtMapBuffer1);
   SetIndexBuffer(1,ExtMapBuffer2);
   SetIndexBuffer(2,ExtMapBuffer3);
   SetIndexBuffer(3,ExtMapBuffer4);
//---- initialization done
   return(0);
  }
//+------------------------------------------------------------------+
//| Custor indicator deinitialization function                       |
//+------------------------------------------------------------------+
int deinit()
  {
//---- TODO: add your code here

//----
   return(0);
  }
//+------------------------------------------------------------------+
//| Custom indicator iteration function                              |
//+------------------------------------------------------------------+
int start()
  {
   double maOpen, maClose, maLow, maHigh;
   double haOpen, haHigh, haLow, haClose;
   if(Bars<=10) return(0);
   ExtCountedBars=IndicatorCounted();
//---- check for possible errors
   if (ExtCountedBars<0) return(-1);
//---- last counted bar will be recounted
   if (ExtCountedBars>0) ExtCountedBars--;
   int pos=Bars-ExtCountedBars-1;
   while(pos>=0)
     {
      maOpen=iMA(NULL,0,MaPeriod,0,MaMetod,MODE_OPEN,pos);
      maClose=iMA(NULL,0,MaPeriod,0,MaMetod,MODE_CLOSE,pos);
      maLow=iMA(NULL,0,MaPeriod,0,MaMetod,MODE_LOW,pos);
      maHigh=iMA(NULL,0,MaPeriod,0,MaMetod,MODE_HIGH,pos);

      haOpen=(ExtMapBuffer3[pos+1]+ExtMapBuffer4[pos+1])/2;
      haClose=(maOpen+maHigh+maLow+maClose)/4;
      haHigh=MathMax(maHigh, MathMax(haOpen, haClose));
      haLow=MathMin(maLow, MathMin(haOpen, haClose));

      ExtMapBuffer3[pos]=haOpen;
      ExtMapBuffer4[pos]=haClose;
 	   pos--;
     }
//----
   return(0);
  }
//+------------------------------------------------------------------+
Comments