Heart Beat
Download script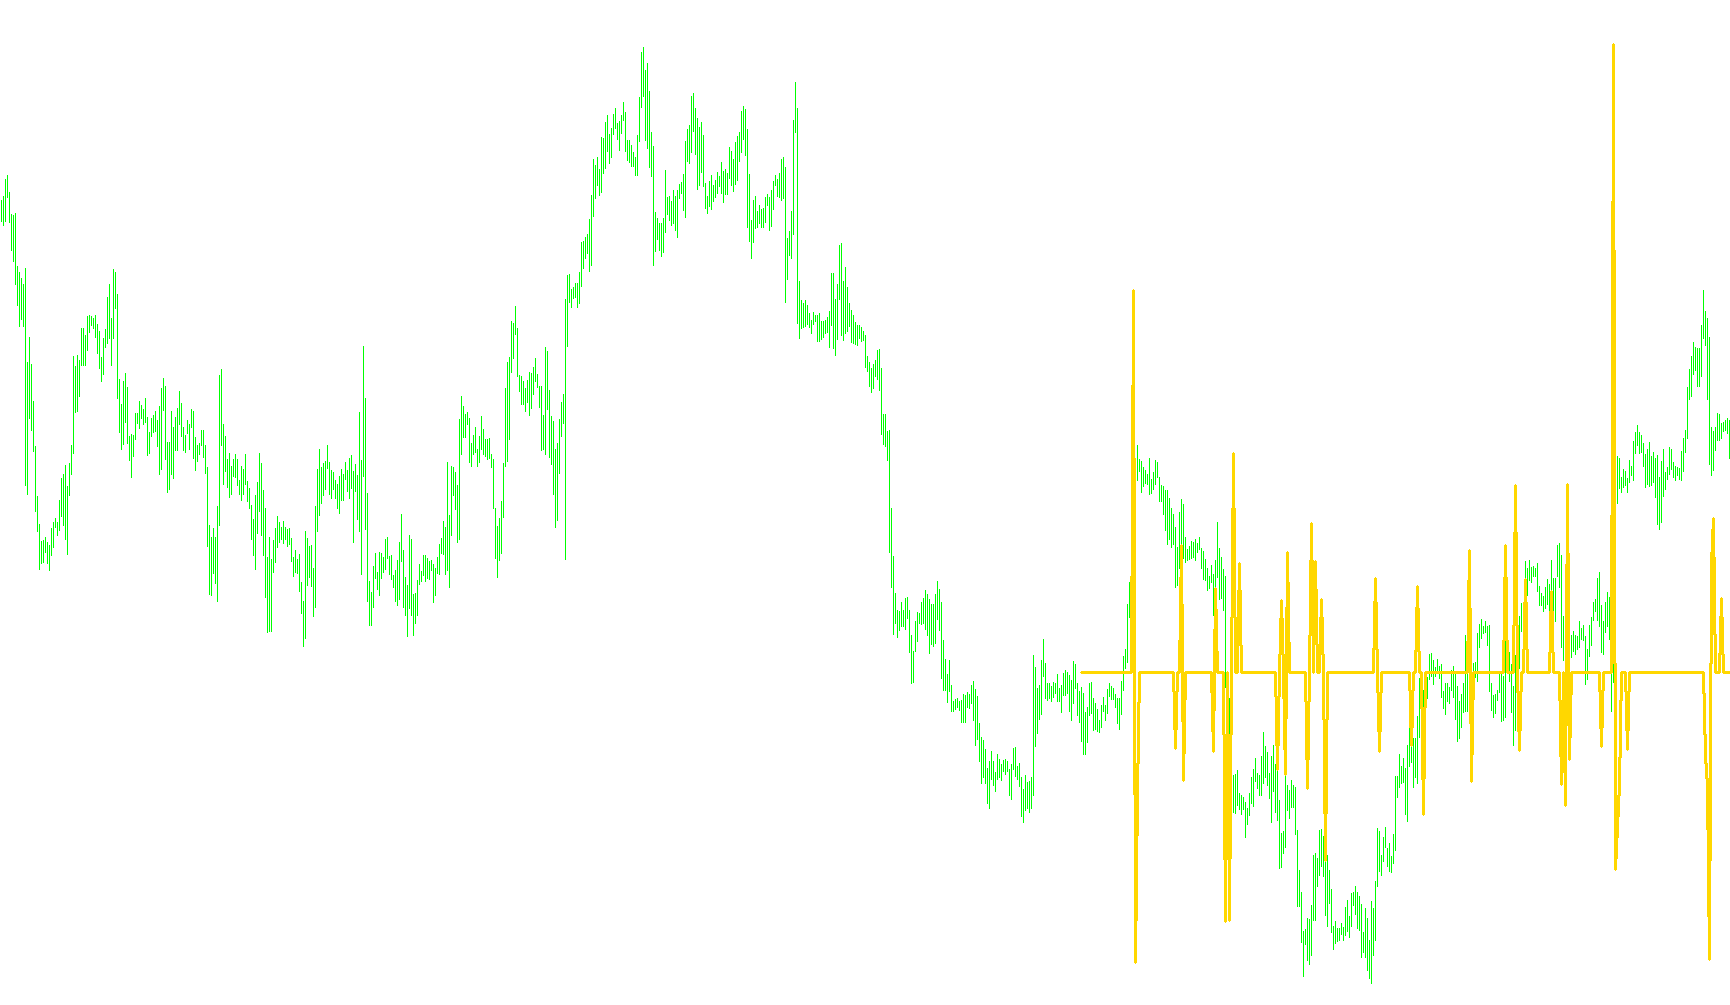
This tool is designed to analyze market trends by identifying specific shifts in price momentum, specifically tailored to align with the principles of Elliott Wave theory. It functions as a visual oscillator that helps traders distinguish between significant market movements and minor "noise."
Core Logic and Functionality
Dynamic Adaptability The script is designed to be versatile across different trading timeframes. It automatically adjusts its sensitivity levels based on the specific chart period you are viewing (such as 1-minute, 5-minute, 30-minute, or 60-minute charts). By recalculating its internal boundaries for each timeframe, the tool ensures that the signals remain relevant whether you are scalping quickly or looking at longer-term trends.
Momentum Calculation At its heart, the logic measures the "force" of price movement. It calculates the difference in momentum between the current price and the preceding data points. Rather than just showing a raw price change, it looks for the rate of change, which helps in identifying how aggressively the market is moving in a particular direction.
Signal Filtering One of the most important features of this script is its ability to filter out insignificant price fluctuations. The logic includes specific "thresholds." If the momentum detected falls within a certain small range (defined as minor movement), the script ignores it and treats it as zero. This prevents the indicator from reacting to every tiny tick, focusing instead on movements that have enough strength to be considered meaningful trends.
Visual Output The result is plotted as a continuous line in a separate window below your main price chart. This allows you to see the "pulse" of the market clearly. When the line moves significantly, it indicates a stronger trend; when it stays flat at zero, it suggests that the market is currently sideways or lacking sufficient momentum to trigger a trend change.
Real-Time Alerts To ensure traders can react quickly, the script includes an automated notification system. If the logic detects a significant momentum shift that crosses the established thresholds in real-time, it generates an immediate alert on your screen. This serves as a proactive warning that a potential "life" event or major move is occurring on the current chart.
//+------------------------------------------------------------------+
//|                                      Elliott Wave Oscillator.mq4 |
//|                                                tonyc2a@yahoo.com |
//|                                                                  |
//+------------------------------------------------------------------+
#property copyright "tonyc2a@yahoo.com"
#property link      ""


#property indicator_separate_window
#property indicator_color1 LightBlue

//---- buffers
double Buffer1[];
double forcey=0;
double upper=0.04;
double lower=-0.04;
double multiplicant=1;
//+------------------------------------------------------------------+
//| Custom indicator initialization function                         |
//+------------------------------------------------------------------+
int init()
  {
//---- indicators
   SetIndexStyle(0,DRAW_LINE,STYLE_SOLID,3);
   SetIndexBuffer(0,Buffer1);
   SetIndexLabel(0,"EWO");
//----
   return(0);
  }
//+------------------------------------------------------------------+
//| Custor indicator deinitialization function                       |
//+------------------------------------------------------------------+
int deinit()
  {
//---- TODO: add your code here

//----
   return(0);
  }
//+------------------------------------------------------------------+
//| Custom indicator iteration function                              |
//+------------------------------------------------------------------+
#property indicator_maximum 0.07
#property indicator_minimum -0.07
int start()


  {
   int    counted_bars=IndicatorCounted();
 if (Period()==30)
 {
 upper=0.2;
 lower=-0.2;
  }
 if (Period()==60)
 {
 upper=0.3;
 lower=-0.3;

 }
 if (Period()==5)
 {
 upper=0.0100;
 lower=-0.0100;
 multiplicant=5;

 }
 if (Period()==1)

 {

 upper=0.0005;
 lower=-0.0005;

 }
 //---- TODO: add your code here
   for(int i=300 ;i>=0;i--)

   {
      forcey=iForce(NULL,0,7,0,PRICE_CLOSE,i)-iForce(NULL,0,7,0,PRICE_CLOSE,i+1);
      if (forcey > 0 && forcey < upper) forcey=0;
      if (forcey < 0 && forcey > lower) forcey=0;


      Buffer1[i]=forcey*multiplicant;
    if (i==0  && forcey !=0)
     {
     Alert(Symbol()," ",Period(),"M  LIFE!");
      }
      }
//----
   return(0);
  }
//+------------------------------------------------------------------+
Comments