gePriceCanal
Download script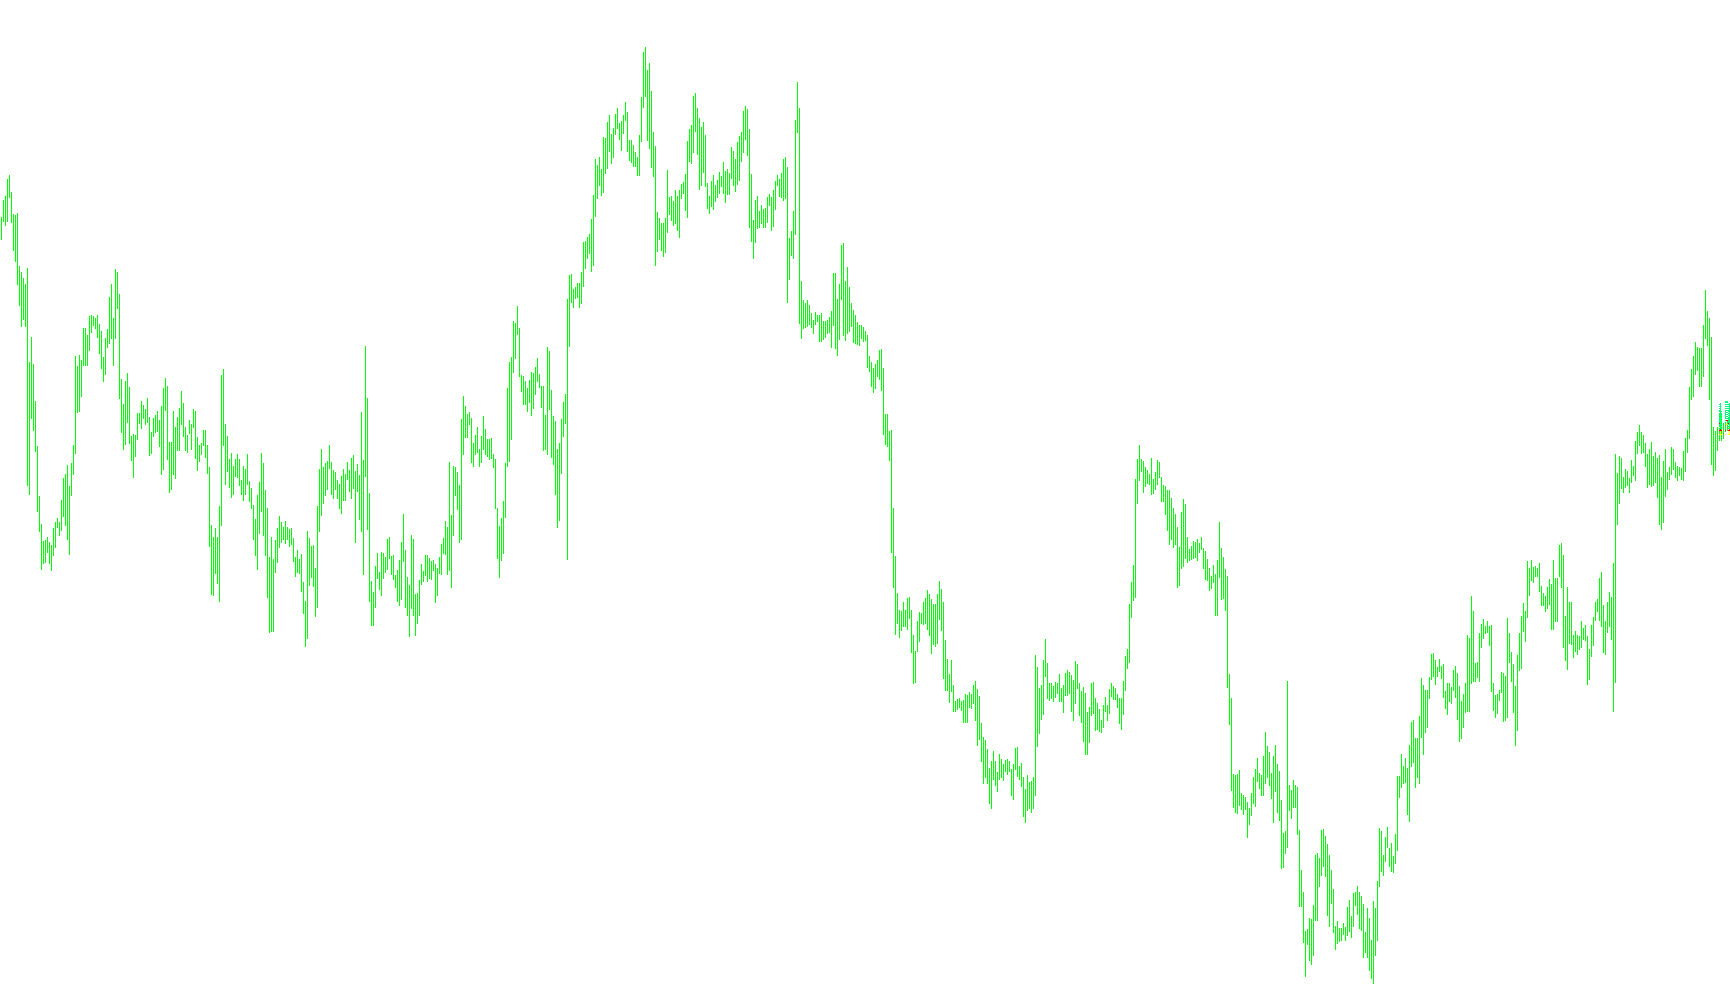
This script is a visual trading tool designed for the MetaTrader platform that creates a dynamic price "canal" or grid on your chart. Its primary purpose is to help traders visualize specific price levels based on historical data and predefined intervals.
Core Logic and Functionality
Time-Based Reference Points The script identifies a specific starting point in time on the chart. It can be configured to look back at a set number of hours from the current moment or to lock onto a fixed time (such as a specific hour during the trading day). Once it determines this "starting point," it looks for the opening price at that exact moment.
Price Level Generation Using that historical opening price as an anchor, the script generates a series of horizontal levels:
- The Opening Price: It identifies the price where your reference period began and marks it clearly on the chart.
- The Primary Line: It calculates a primary offset from that opening price (based on user-defined settings).
- The Canal Grid: It then projects a series of additional lines at regular intervals starting from that first offset. You can choose whether these lines project upwards or downwards.
Visual Representation Instead of just showing simple data, the script draws actual objects on your chart:
- Dotted Lines: It creates a series of horizontal dotted lines to form the "canal," making it easy to see various price zones at a glance.
- Price Labels: To ensure clarity, the script automatically places text labels on the right side of these lines. These labels display the exact price value for every line in the canal.
- Color Coding: The tool uses distinct colors to differentiate between the opening price, the first primary line, and the subsequent canal lines, allowing for quick visual navigation.
Summary of User Customization
The logic allows a trader to customize how these levels are behaved by adjusting:
- Timeframe: How many hours back to look.
- Direction: Whether the price grid should move up or down from the reference point.
- Density: How many lines should be drawn in total and how far apart each line should be spaced.
In essence, this tool acts as a "price map," automatically drawing a customized corridor of horizontal levels based on a specific historical starting price, helping traders identify potential support, resistance, or target zones instantly.
//+------------------------------------------------------------------+
//|																gePriceCanal.mq4		|
//|                      Copyright © 2007, ver 1.0							|
//|                      Forte928           									|
//+------------------------------------------------------------------+
#property copyright "Forte928"
#property link      ""
#define		IndicatorName "gePriceCanal"

#define		DaySecond		86400
#define		HourSecond		3600
#define		MinuteSecond	60
#property indicator_chart_window
//#property indicator_separate_window


#property indicator_buffers 2
#property indicator_color1 Yellow
#property indicator_color2 Red

extern bool		Fixed			=false;			// (true - èñòîëüçóåò ôèêñèðîâàíèå çíà÷åíèå ÷àñà / false - îòñòóï îò òåêóùåãî âðåìåíè)
extern int		HourPrd		=3;				// ïåðèîä îòîáðàæåíèÿ âðåìåíè
extern int		LineCount	=10;				// êîë-âî ëèíèé
extern int		LineFirst	=10;				// îòñòóï ïåðâîé ëèíèè
extern int		LineStep		=5;				// øàã îòñòóïà îò ïåðâîé ëèíèè
extern int		DrawDirect	= 1;				// íàïðàâëåíèå îòðèñîâêè ëèíèé - (-1) - Âíèç (0/1) - ââåðõ
extern color	OpenColor	= Yellow;		// öâåò öåíû îòêðûòèÿ
extern color	FirstColor	= Red;			// öâåò ïåðâîé ëèíèè
extern color	NextColor	= SpringGreen;	// öâåò ñëåäóþùèõ ëèíèé
//double  FreqTOL  =0.0001;//Tolerance of frequency calculation for Method 1

double	FxView1[];
double	FxView2[];
//~~~~~~~~~~~~~~~~~~~~~~~~~~~~~~~~~~~~~~~~~~~~~~~~~~~~V~~~~~~~~~~~~~~~~~~~~~~~~~~~~~~~~~~~~~~~~~~~~~~~~~~~~~~
//~~~~~~~~~~~~~~~~~~~~~~~~~~~~~~~~~~~~~~~~~~~~~~~~~~~~V~~~~~~~~~~~~~~~~~~~~~~~~~~~~~~~~~~~~~~~~~~~~~~~~~~~~~~
//~~~~~~~~~~~~~~~~~~~~~~~~~~~~~~~~ Custom indicator initialization function ~~~~~~~~~~~~~~~~~~~~~~~~~~~~~~~~~
int init()
  {
//---- initialization program values  --------------------------------
	SetupChartLineColor(0,FxView1,0,1,OpenColor,"Price");// SetIndexStyle(0,DRAW_LINE,STYLE_SOLID,1); SetIndexBuffer(0,ValueBuf0);
	SetupChartLineColor(1,FxView2,0,1,FirstColor,"Line1");// SetIndexStyle(0,DRAW_LINE,STYLE_SOLID,1); SetIndexBuffer(0,ValueBuf0);
	SetIndexStyle(0,DRAW_LINE,STYLE_DOT,1,OpenColor);
	SetIndexStyle(1,DRAW_LINE,STYLE_DOT,1,FirstColor);
   IndicatorShortName(IndicatorName);
  	IndicatorDigits(MarketInfo(Symbol(),MODE_DIGITS));
//----
   return(0);
  }
//~~~~~~~~~~~~~~~~~~~~~~~~~~~~~~~~~~~~~~~~~~~~~~~~~~~~V~~~~~~~~~~~~~~~~~~~~~~~~~~~~~~~~~~~~~~~~~~~~~~~~~~~~~~
//~~~~~~~~~~~~~~~~~~~~~~~~~~~~~~~ Custom indicator deinitialization function ~~~~~~~~~~~~~~~~~~~~~~~~~~~~~~~~
//~~~~~~~~~~~~~~~~~~~~~~~~~~~~~~~~~~~~~~~~~~~~~~~~~~~~~~~~~~~~~~~~~~~~~~~~~~~~~~~~~~~~~~~~~~~~~~~~~~~~~~~~~~~
int deinit()
  {
//----
	ObjectsLocalDelete(LineCount);
//----
   return(0);
  }
//~~~~~~~~~~~~~~~~~~~~~~~~~~~~~~~~~~~~~~~~~~~~~~~~~~~~V~~~~~~~~~~~~~~~~~~~~~~~~~~~~~~~~~~~~~~~~~~~~~~~~~~~~~~
//~~~~~~~~~~~~~~~~~~~~~~~~~~~~~~~~~~~~~~~~~~~ Start defination ~~~~~~~~~~~~~~~~~~~~~~~~~~~~~~~~~~~~~~~~~~~~~~
//~~~~~~~~~~~~~~~~~~~~~~~~~~~~~~~~~~~~~~~~~~~~~~~~~~~~~~~~~~~~~~~~~~~~~~~~~~~~~~~~~~~~~~~~~~~~~~~~~~~~~~~~~~~
int start()
{
//+-------------------------- Begin Cycle ---------------------------------------------------+\\
	if (DrawDirect<0) DrawDirect=-1;
	if (DrawDirect>=0) DrawDirect=1;
	datetime TimeLast=Time[0];
	TimeLast=TimeLast-TimeSeconds(TimeLast);
	datetime TimeFirst=TimeLast-HourPrd*HourSecond+TimeMinute(TimeLast)*60;
	if (Fixed==true) {
		TimeFirst=Time[0];
		if (MathAbs(TimeHour(TimeFirst)-HourPrd)<=1) TimeFirst=TimeFirst-DaySecond;
		TimeFirst=TimeFirst-(TimeHour(TimeFirst)-HourPrd)*HourSecond-TimeMinute(TimeFirst)*MinuteSecond-TimeSeconds(TimeFirst);
		//Print(TimeToStr(TimeFirst,TIME_DATE|TIME_MINUTES|TIME_SECONDS));
	}

	TimeFirst=Time[iBarShift(Symbol(),Period(),TimeFirst,false)];
	int IndexFirst=iBarShift(Symbol(),Period(),TimeFirst,false);
	int IndexLast=iBarShift(Symbol(),Period(),TimeLast,false);
	double PriceFirst=Open[IndexFirst];


	ObjectsLocalDelete(LineCount);
	//For
	InitChart(FxView1);
	InitChart(FxView2);
	for (int Ix=IndexFirst;Ix>=IndexLast;Ix--) {
		FxView1[Ix]=PriceFirst;
		FxView2[Ix]=PriceFirst+LineFirst*DrawDirect*Point;
	}
	DrawTextCanal("TextOpen",TimeLast,PriceFirst,DoubleToStr(PriceFirst,Digits),10,OpenColor);
	PriceFirst=PriceFirst+LineFirst*DrawDirect*Point;
	DrawTextCanal("TextLine1",TimeLast,PriceFirst,DoubleToStr(PriceFirst,Digits),10,FirstColor);

	for (Ix=1;Ix<=LineCount;Ix++) {
		double PriceDraw=PriceFirst+LineStep*DrawDirect*Ix*Point;
		DrawLineCanal("LinePrice"+(Ix+1),TimeFirst,PriceDraw,TimeLast,PriceDraw,1,NextColor);
		DrawTextCanal("TextLine"+(Ix+1),TimeLast,PriceDraw,DoubleToStr(PriceDraw,Digits),10,NextColor);
	}
//----
   return;
  }
//-----------------------------------------------------------------------------------------------
void DrawTextCanal(string iName,datetime iTimeFirst,double iPriceFirst,string Text,int iSize,color iColor)
{
	ObjectCreate(iName,OBJ_TEXT,0,iTimeFirst+3*Period()*60,iPriceFirst+2*Point);
	ObjectSetText(iName,Text,iSize, "Times New Roman", iColor);
	return;
}
//~~~~~~~~~~~~~~~~~~~~~~~~~~~~~~~~~~~~~~~~~~~~~~~~~~~~~~~~~~~~~~~~~~~~~~~~~~~~~~~~~~~~~~~~~~~~~~~~~~~~~~~~~~~~~~~
void DrawLineCanal(string iName,datetime iTimeFirst,double iPriceFirst,datetime iTimeLast,double iPriceLast,int iWidth,color iColor)
{
	ObjectCreate(iName,OBJ_TREND,0,iTimeFirst,iPriceFirst,iTimeLast,iPriceLast);
	ObjectSet(iName,OBJPROP_COLOR,iColor);
	ObjectSet(iName,OBJPROP_WIDTH,iWidth);
	ObjectSet(iName,OBJPROP_RAY,false);
	ObjectSet(iName,OBJPROP_STYLE,STYLE_DOT);
	return;
}
//~~~~~~~~~~~~~~~~~~~~~~~~~~~~~~~~~~~~~~~~~~~~~~~~~~~~~~~~~~~~~~~~~~~~~~~~~~~~~~~~~~~~~~~~~~~~~~~~~~~~~~~~~~~~~~~
void ObjectsLocalDelete(int iLineCount)
{
	ObjectDelete("TextOpen");
	ObjectDelete("TextLine1");

	for (int Sx=1;Sx<=iLineCount;Sx++) {
		ObjectDelete("LinePrice"+(Sx+1));
		ObjectDelete("TextLine"+(Sx+1));
	}
	return;
}
//~~~~~~~~~~~~~~~~~~~~~~~~~~~~~~~~~~~~~~~~~~~~~~~~~~~~~~~~~~~~~~~~~~~~~~~~~~~~~~~~~~~~~~~~~~~~~~~~~~~~~~~~~~~~~~~
//~~														 Style active Line																~~
//~~~~~~~~~~~~~~~~~~~~~~~~~~~~~~~~~~~~~~~~~~~~~~~~~~~~~~~~~~~~~~~~~~~~~~~~~~~~~~~~~~~~~~~~~~~~~~~~~~~~~~~~~~~~~~~
void SetupChartLine(int Index,double& ViewAy[],int Style,int Width,string Label)
{
	switch(Style)
	{
		case 0 : SetIndexStyle(Index,DRAW_LINE,STYLE_SOLID,Width);break;
		case 1 : SetIndexStyle(Index,DRAW_HISTOGRAM,STYLE_SOLID,Width);break;
		case 2 : SetIndexStyle(Index,DRAW_ARROW,STYLE_SOLID,Width);break;
		default : SetIndexStyle(Index,DRAW_LINE,STYLE_SOLID,Width);break;
	}
	if (Label!="") SetIndexLabel(Index,Label);
	SetIndexBuffer(Index,ViewAy);
	return(0);
}
//------------------------------------------ Style active Line --------------------------
void SetupChartLineColor(int Index,double& ViewAy[],int Style,int Width,color ColorLine,string Label)
{
	switch(Style)
	{
		case 0 : SetIndexStyle(Index,DRAW_LINE,STYLE_SOLID,Width,ColorLine);break;
		case 1 : SetIndexStyle(Index,DRAW_HISTOGRAM,STYLE_SOLID,Width,ColorLine);break;
		case 2 : SetIndexStyle(Index,DRAW_ARROW,STYLE_SOLID,Width,ColorLine);break;
		default : SetIndexStyle(Index,DRAW_LINE,STYLE_SOLID,Width,ColorLine);break;
	}
	if (Label!="") SetIndexLabel(Index,Label);
	SetIndexBuffer(Index,ViewAy);
	return(0);
}
//~~~~~~~~~~~~~~~~~~~~~~~~~~~~~~~~~~~~~~~~~~~~~~~~~~~~~~~~~~~~~~~~~~~~~~~~~~~~~~~~~~~~~~~~~~~~~~~~~~~~~~~~~~~~~~~
void InitChart(double& ayShift[])									// Ñìåùåíèå
{
	if (ArraySize(ayShift)>0) ArrayInitialize(ayShift,EMPTY_VALUE);
}
//~~~~~~~~~~~~~~~~~~~~~~~~~~~~~~~~~~~~~~~~~~~~~~~~~~~~~~~~~~~~~~~~~~~~~~~~~~~~~~~~~~~~~~~~~~~~~~~~~~~~~~~~~~~~~~~
Comments