ForexOFFTrend4(2)
Download script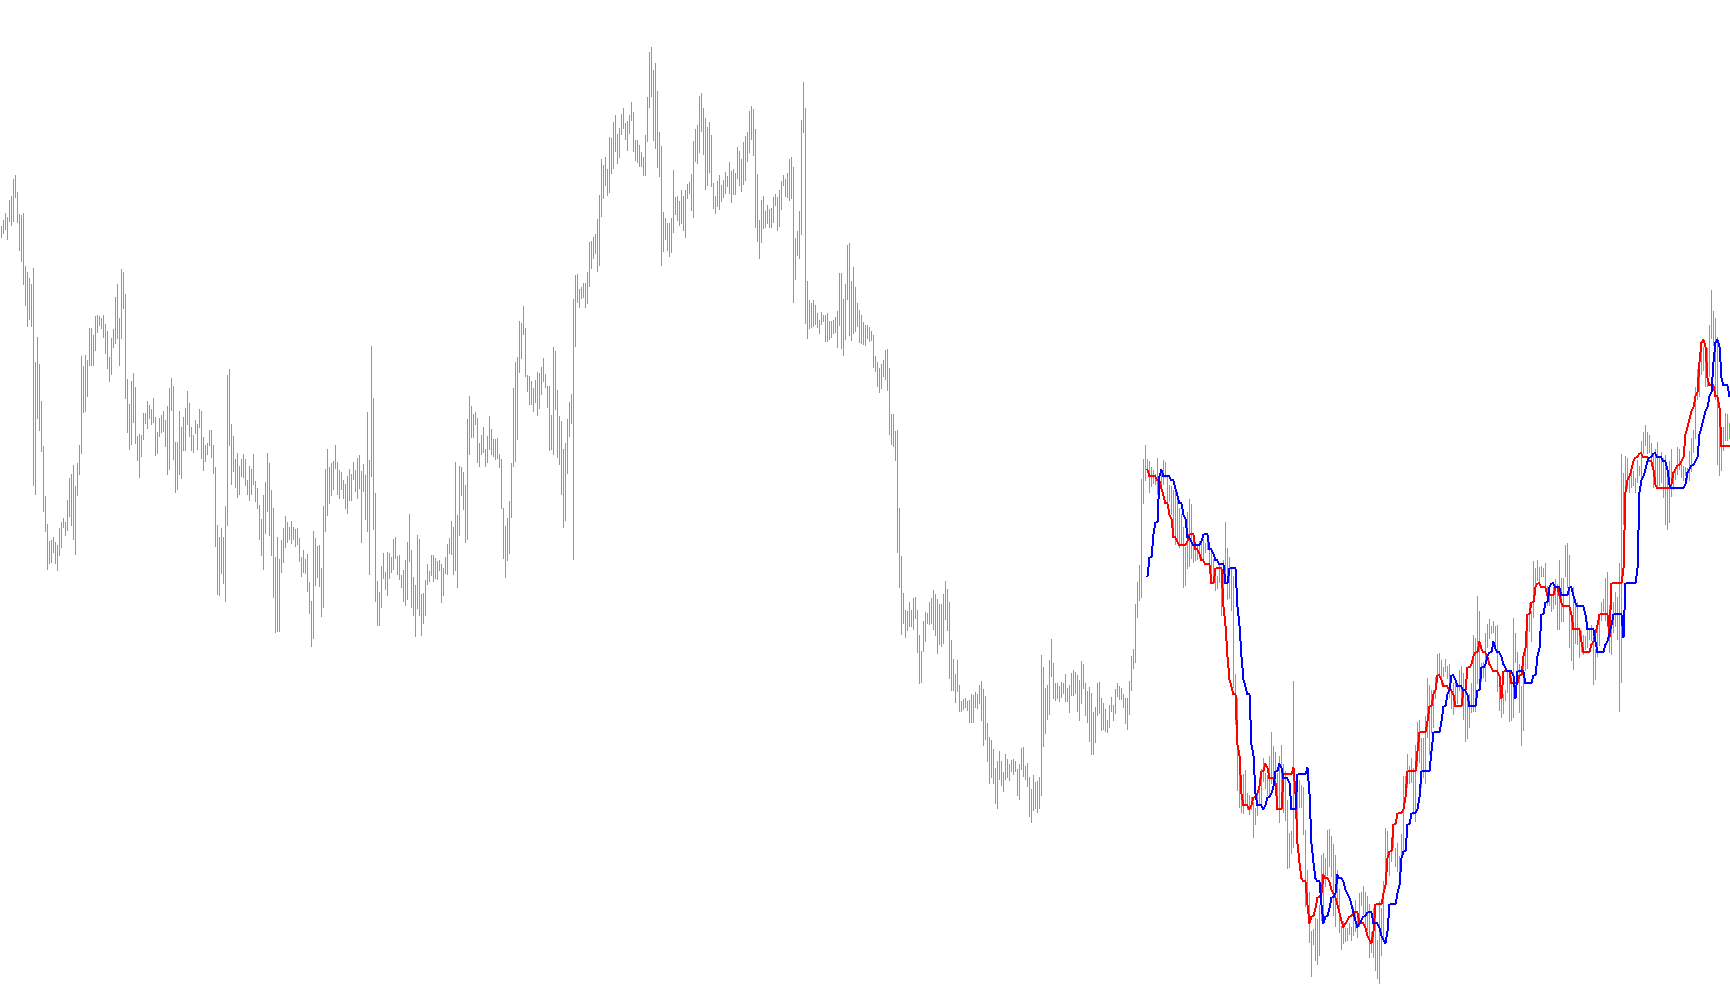
The SilverTrend script is a visual analysis tool designed to help traders identify potential price extremes and momentum shifts by calculating specific "threshold" levels based on recent market activity. Rather than just following the current price, this indicator focuses on historical highs and lows within a defined window to project potential boundary lines.
How the Logic Works
1. Scanning the Recent History The tool looks back at a specific number of candles (the "CountBars" parameter) to understand the recent range of the market. It identifies the highest price reached and the lowest price dropped during this period. By establishing these two points, the script creates a "trading zone" for the current timeframe.
2. Calculating Dynamic Boundaries Instead of using fixed numbers, the script calculates specific mathematical boundaries based on that high-low range. It uses two primary percentages to determine its markers:
- Minimum Threshold: A lower-intensity boundary used to gauge the inner limits of price movement.
- Maximum Threshold: A higher-intensity boundary used to identify more significant "ceiling" or "floor" levels.
3. Visualizing Trends (The Red and Blue Lines) The script generates two distinct lines on your chart:
- Red Line: Represents one calculated dynamic threshold based on the market's recent behavior.
- Blue Line: Represents an alternative calculated threshold.
By plotting these lines simultaneously, the tool allows you to see how these "boundaries" interact with the live price. When the price moves between or around these lines, it provides a visual representation of the current volatility and potential structural limits.
4. Real-Time Data Feedback A unique feature of this script is its ability to provide an on-screen text summary. It constantly monitors the relationship between the Red and Blue lines. If one line crosses above or below the other, the script automatically updates a text comment on your screen. This provides you with a quick numerical snapshot of the current "Buy" and "Sell" values for the most recent data points, allowing you to see exactly where the boundaries sit at a glance without having to manually inspect the chart lines.
Summary for the User
Essentially, this script acts as an automated "boundary tracker." It looks at how high and low the market has traveled recently and draws two moving lines that represent potential price limits. When these lines shift or cross each other, it signals a change in the calculated price structure, helping you visualize whether the market is expanding, contracting, or reaching a significant technical zone.
//+------------------------------------------------------------------+
//|                                                 SilverTrend .mq4 |
//|                             SilverTrend  rewritten by CrazyChart |
//|                                                 http://viac.ru/  |
//+------------------------------------------------------------------+
#property copyright "SilverTrend  rewritten by CrazyChart"
#property link      "http://viac.ru/ "

#property indicator_chart_window
#property indicator_buffers 2
#property indicator_color1 Red
#property indicator_color2 Blue
//---- input parameters

extern int       CountBars=300;
extern int       SSP=7;
extern int       Decimals=4;
extern double    Kmin=1.6;
extern double    Kmax=50.6; //24 21.6 21.6


//---- buffers
double ExtMapBuffer1[];
double ExtMapBuffer2[];

//+------------------------------------------------------------------+
//| Custom indicator initialization function                         |
//+------------------------------------------------------------------+
int init()
  {
//---- indicators
   IndicatorBuffers(2);
   SetIndexStyle(0,DRAW_LINE,0,2,Red);
   SetIndexBuffer(0,ExtMapBuffer1);
   SetIndexStyle(1,DRAW_LINE,0,2,Blue);
   SetIndexBuffer(1,ExtMapBuffer2);


//----
   return(0);
  }
//+------------------------------------------------------------------+
//| Custor indicator deinitialization function                       |
//+------------------------------------------------------------------+
int deinit()
  {

   return(0);
  }
//+------------------------------------------------------------------+
//| Custom indicator iteration function                              |
//+------------------------------------------------------------------+
int start()
  {

  if (CountBars>=Bars) CountBars=Bars;
   SetIndexDrawBegin(0,Bars-CountBars+SSP);
   SetIndexDrawBegin(1,Bars-CountBars+SSP);
  int i, i2,loopbegin,counted_bars=IndicatorCounted();
  double SsMax, SsMin, K, val1, val2, smin, smax, price;

  if(Bars<=SSP+1) return(0);
  //---- initial zero

//K=33-RISK;

/*
if (firstTime==true)   {
   loopbegin = CountBars;
   if (loopbegin>(Bars-2*SSP+1)) loopbegin=Bars-2*SSP+1;
   firstTime=False;
}; ðóäèìåíò ñòàðîé ïðîãðàììû
*/
  if(Bars<=SSP+1) return(0);
//---- initial zero

//+++++++
if(counted_bars<SSP+1)
   {
      for(i=1;i<=SSP;i++) ExtMapBuffer1[CountBars-i]=0.0;
      for(i=1;i<=SSP;i++) ExtMapBuffer2[CountBars-i]=0.0;
   }
//+++++++-SSP


for(i=CountBars-SSP;i>=0;i--) {


  SsMax = High[Highest(NULL,0,MODE_HIGH,SSP,i-SSP+1)];
  SsMin = Low[Lowest(NULL,0,MODE_LOW,SSP,i-SSP+1)];
   smin = SsMin-(SsMax-SsMin)*Kmin/100;
   smax = SsMax-(SsMax-SsMin)*Kmax/100;

   ExtMapBuffer1[i-SSP+6]=NormalizeDouble(smax,Decimals);
   ExtMapBuffer2[i-SSP-1]=NormalizeDouble(smax,Decimals);

   val1 = ExtMapBuffer1[0];
   val2 = ExtMapBuffer2[0];


if (val1 > val2) {
   Comment( "\nBuy 0 ",ExtMapBuffer1[0], " Sell 0 ",ExtMapBuffer2[0],
            "\nBuy 1 ",ExtMapBuffer1[1], " Sell 1 ",ExtMapBuffer2[1],
            "\nBuy 2 ",ExtMapBuffer1[2], " Sell 2 ",ExtMapBuffer2[2],
            "\nBuy 3 ",ExtMapBuffer1[3], " Sell 3 ",ExtMapBuffer2[3],
            "\nBuy 4 ",ExtMapBuffer1[4], " Sell 4 ",ExtMapBuffer2[4],
            "\nBuy 5 ",ExtMapBuffer1[5], " Sell 5 ",ExtMapBuffer2[5],
            "\nBuy 6 ",ExtMapBuffer1[6], " Sell 6 ",ExtMapBuffer2[6]);

   /*Comment( "\nBuy 0 ",ExtMapBuffer1[0], " Sell 0 ",NormalizeDouble(smax,Decimals));*/
}

if (val1 < val2) {
   Comment( "\nSell 0 ",ExtMapBuffer2[0]," Buy 0 ",ExtMapBuffer1[0],
            "\nSell 1 ",ExtMapBuffer2[1]," Buy 1 ",ExtMapBuffer1[1],
            "\nSell 2 ",ExtMapBuffer2[2]," Buy 2 ",ExtMapBuffer1[2],
            "\nSell 3 ",ExtMapBuffer2[3]," Buy 3 ",ExtMapBuffer1[3],
            "\nSell 4 ",ExtMapBuffer2[4]," Buy 4 ",ExtMapBuffer1[4],
            "\nSell 5 ",ExtMapBuffer2[5]," Buy 5 ",ExtMapBuffer1[5],
            "\nSell 6 ",ExtMapBuffer2[6]," Buy 6 ",ExtMapBuffer1[6]);
}

}


//----
   return(0);
  }
//+------------------------------------------------------------------+
Comments