Fibo_v1
Download script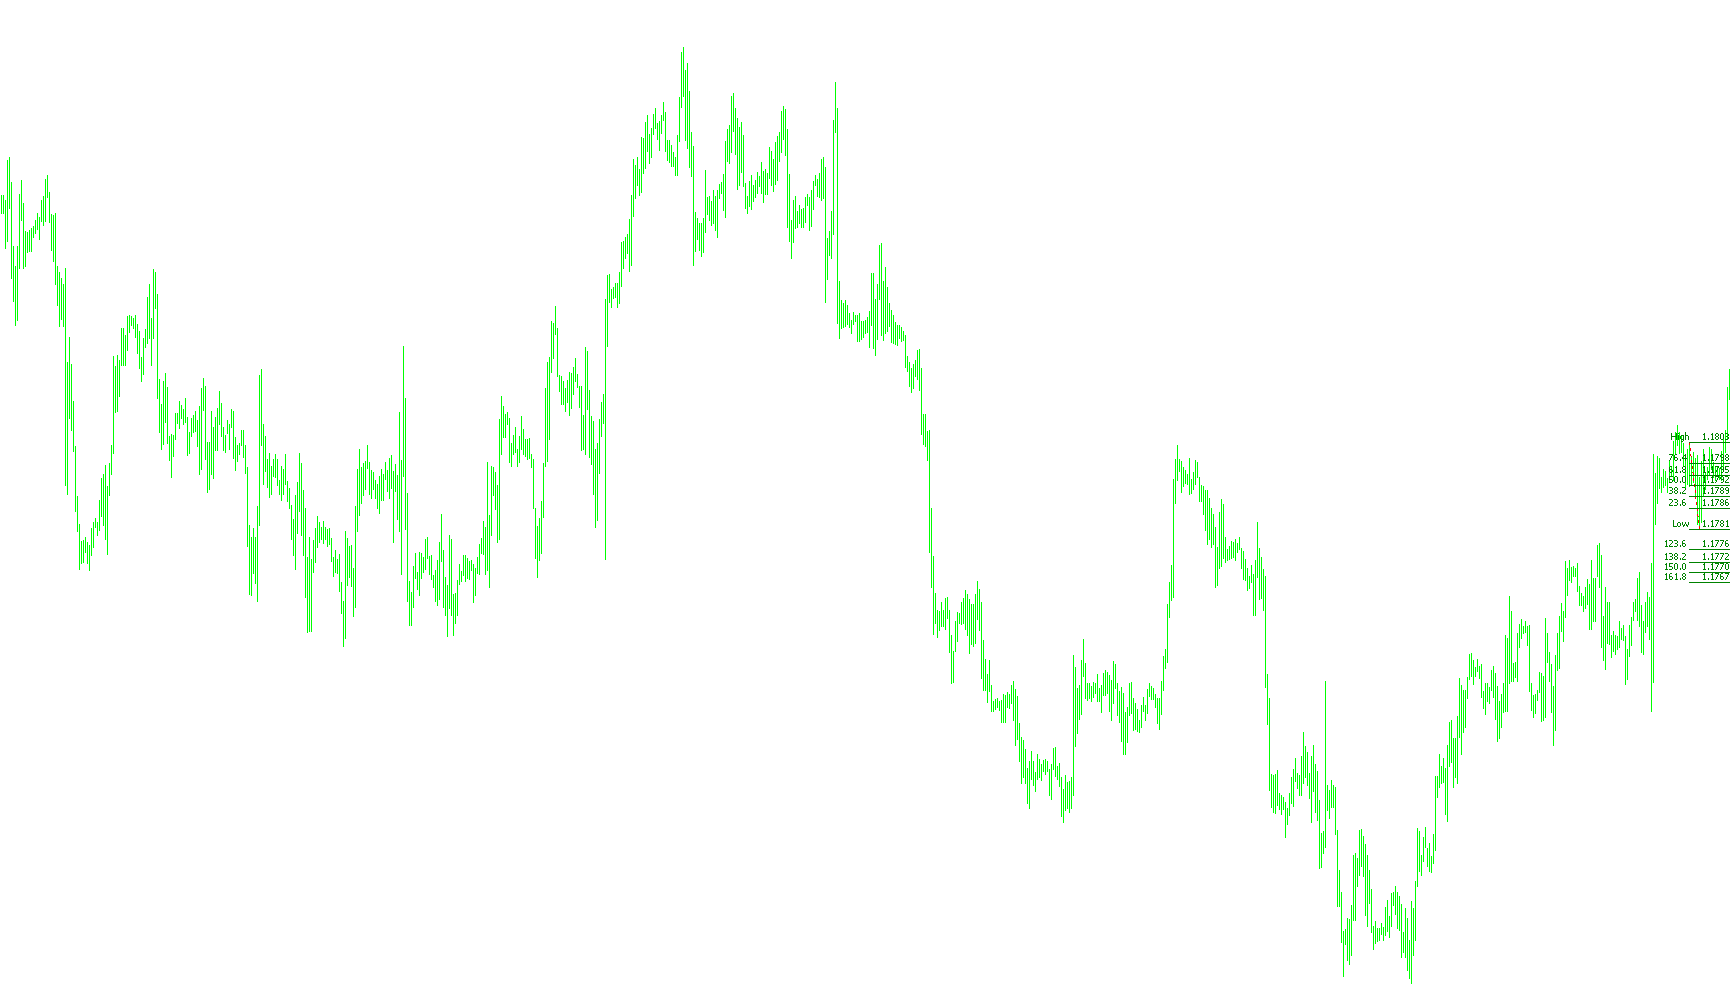
This tool is designed to automatically identify significant price movements on a trading chart and project Fibonacci retracement levels based on those movements. Instead of requiring a trader to manually select the start and end points of a trend, the script uses specific logic to scan recent market history and pinpoint the most relevant structural highs and lows.
How the Logic Works
1. Market Scanning (Lookback Period) The script looks back over a specific number of previous price bars (defined by the "lookback" setting). It examines the price action within this window to determine where major shifts occurred.
2. Identifying Significant Peaks and Valleys Rather than simply taking the absolute highest or lowest price, the script uses a comparative logic to find "turning points."
- For Lows: It checks if a specific candle's low is lower than the candles immediately surrounding it. This helps identify "troughs" or local bottoms in the market.
- For Highs: It checks if a specific candle's high is higher than the candles immediately surrounding it. This helps identify "peaks" or local tops in the market.
3. Dynamic Trend Detection Once the script identifies these peaks and valleys, it compares their positions in time:
- If the highest point occurred before the lowest point, it recognizes a specific directional flow.
- If the lowest point occurred before the highest point, it recognizes the opposite flow. The tool automatically arranges the Fibonacci levels to match whichever direction the market moved, ensuring the retracement percentages (like 50%, 61.8%, etc.) are oriented correctly regardless of whether the trend was up or down.
4. Visual Output After identifying these coordinates, the script draws a Fibonacci tool directly onto your chart. It populates this tool with a comprehensive set of standard levels, including:
- Standard Retracements: Common levels such as 23.6%, 38.2%, 50%, and 61.8%.
- Extended Levels: Additional levels for more advanced analysis, ranging from -23.6% to 261.8%.
Summary of Behavior
The script automates the "discovery" phase of technical analysis. It searches the recent past for significant structural turning points and automatically draws a Fibonacci map on your chart so you can immediately see potential support and resistance zones based on that specific price move.
//+------------------------------------------------------------------+
//|                                                         Fibo.mq4 |
//|                                                        Don Perry |
//|                                                www.fxAdvisor.com |
//+------------------------------------------------------------------+
#property copyright "Don Perry"
#property link      "donperry1[@t]gmail.com"

#property indicator_chart_window
//+------------------------------------------------------------------+
//| Custom indicator initialization function                         |
//+------------------------------------------------------------------+
int init()
  {
//---- indicators
//----
   return(0);
  }
//+------------------------------------------------------------------+
//| Custom indicator deinitialization function                       |
//+------------------------------------------------------------------+
int deinit()
  {
//----
   ObjectDelete("Fibo");
//----
   return(0);
  }
//+------------------------------------------------------------------+
//| Custom indicator iteration function                              |
//+------------------------------------------------------------------+
extern int lookback = 24;
extern int lastbar = 0;
extern color FibColor= Green;
int start()
  {
  ObjectDelete("Fibo");
   int    counted_bars=IndicatorCounted();
//----
   double lowest=1000, highest=0;
   datetime T1,T2;
   for(int i=lookback+lastbar;i>lastbar+1;i--)
   {
      double curLow0=iLow(Symbol(),Period(),i-2);
      double curLow1=iLow(Symbol(),Period(),i+1);
      double curLow2=iLow(Symbol(),Period(),i);
      double curLow3=iLow(Symbol(),Period(),i-1);
      double curLow4=iLow(Symbol(),Period(),i-2);

       double curHigh0=iHigh(Symbol(),Period(),i+2);
       double curHigh1=iHigh(Symbol(),Period(),i+1);
        double curHigh2=iHigh(Symbol(),Period(),i);
         double curHigh3=iHigh(Symbol(),Period(),i-1);
         double curHigh4=iHigh(Symbol(),Period(),i-2);

      if(curLow2<=curLow1 && curLow2<=curLow1 && curLow2<=curLow0 )
      {
      if(lowest>curLow2){
         lowest=curLow2;
         T2=iTime(Symbol(),Period(),i);}
      }

      if(curHigh2>=curHigh1 && curHigh2>=curHigh3&& curHigh2>=curHigh4)
      {
         if(highest<curHigh2){
         highest=curHigh2;
         T1=iTime(Symbol(),Period(),i);}
      }


   }


   Comment(highest, lowest);
   if(T1<T2)
   {ObjectCreate("Fibo", OBJ_FIBO, 0, T1, highest,T2,lowest);}
   else{
    ObjectCreate("Fibo", OBJ_FIBO, 0, T2, lowest, T1,highest);
   }
//----

string fiboobjname = "Fibo";
ObjectSet(fiboobjname, OBJPROP_FIBOLEVELS, 11);
     ObjectSet(fiboobjname, OBJPROP_FIRSTLEVEL, 0.0);
   ObjectSetFiboDescription(fiboobjname,0,"Low    %$");
   ObjectSet(fiboobjname, OBJPROP_FIRSTLEVEL+1, 0.236);
   ObjectSetFiboDescription(fiboobjname,1,"23.6     %$");
   ObjectSet(fiboobjname, OBJPROP_FIRSTLEVEL+2, 0.382);
   ObjectSetFiboDescription(fiboobjname,2,"38.2     %$");
   ObjectSet(fiboobjname, OBJPROP_FIRSTLEVEL+3, 0.50);
   ObjectSetFiboDescription(fiboobjname,3,"50.0     %$");
   ObjectSet(fiboobjname, OBJPROP_FIRSTLEVEL+4, 0.618);
   ObjectSetFiboDescription(fiboobjname,4,"61.8     %$");
   ObjectSet(fiboobjname, OBJPROP_FIRSTLEVEL+5, 0.764);
   ObjectSetFiboDescription(fiboobjname,5,"76.4     %$");
   ObjectSet(fiboobjname, OBJPROP_FIRSTLEVEL+6, 1.000);
   ObjectSetFiboDescription(fiboobjname,6,"High    %$");
   ObjectSet(fiboobjname, OBJPROP_FIRSTLEVEL+7, -0.236);
   ObjectSetFiboDescription(fiboobjname,7,"123.6     %$");
   ObjectSet(fiboobjname, OBJPROP_FIRSTLEVEL+8, -0.382);
   ObjectSetFiboDescription(fiboobjname,8,"138.2     %$");
   ObjectSet(fiboobjname, OBJPROP_FIRSTLEVEL+9, -0.50);
      ObjectSetFiboDescription(fiboobjname,9,"150.0     %$");
   ObjectSet(fiboobjname, OBJPROP_FIRSTLEVEL+10, -0.618);
   ObjectSetFiboDescription(fiboobjname,10,"161.8     %$");
   ObjectSet(fiboobjname, OBJPROP_FIRSTLEVEL+11, 2.000);
   ObjectSetFiboDescription(fiboobjname,11,"200.0     %$");
   ObjectSet(fiboobjname, OBJPROP_FIRSTLEVEL+12, 2.618);
   ObjectSetFiboDescription(fiboobjname,12,"261.8     %$");
   ObjectSet( "Fibo", OBJPROP_LEVELCOLOR, FibColor) ;
   ObjectsRedraw();
   return(0);
  }
//+------------------------------------------------------------------+
Comments