Fibo
Download script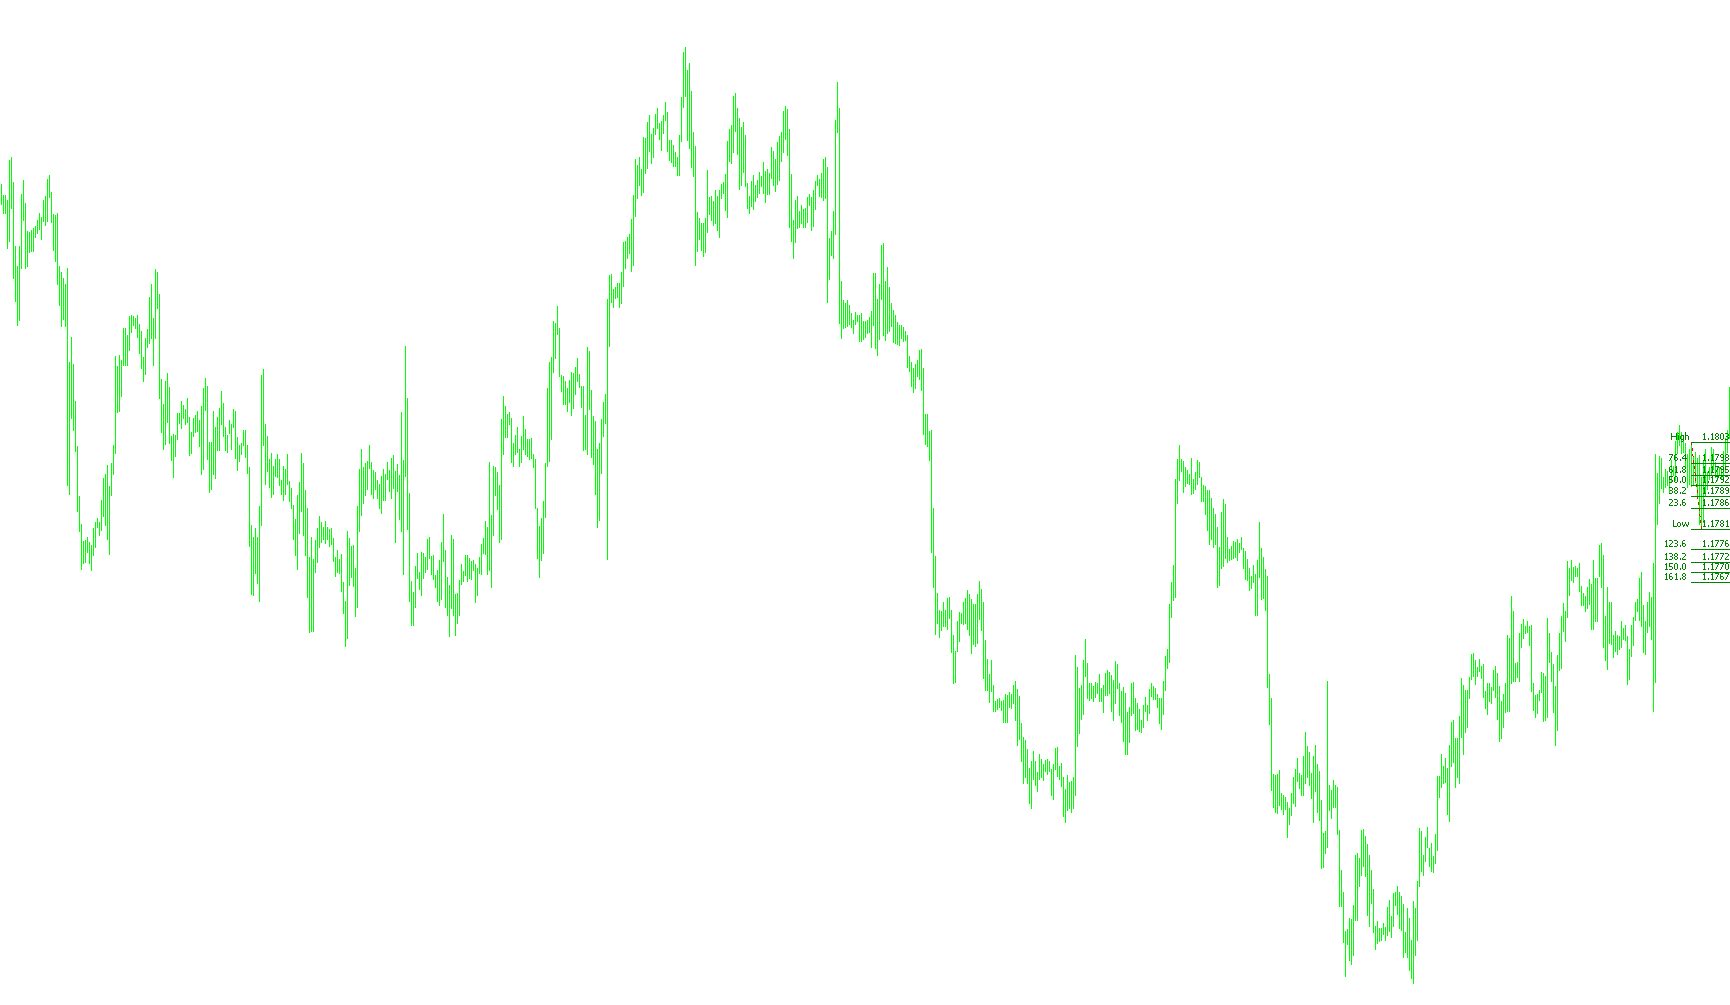
This tool is designed to automatically identify and plot Fibonacci retracement levels on your trading chart based on specific price action patterns. Rather than drawing a static line, the script scans recent market history to find significant "swing" points—specifically peaks and valleys—to establish the boundaries for the Fibonacci levels.
How the Logic Works
1. Dynamic Market Scanning The script looks back over a defined number of candles (determined by the user settings) to analyze the movement of the market. It doesn't just look at the highest and lowest prices in that window; it specifically searches for structural turning points.
2. Identifying Peaks and Valleys To find the most relevant points for a Fibonacci retracement, the script applies a verification logic to each candle:
- Valleys (Lows): It identifies a point as a "low" only if that specific price point is lower than the candles immediately surrounding it.
- Peaks (Highs): Similarly, it identifies a point as a "high" only if it stands taller than the candles immediately preceding and following it.
By using this multi-candle comparison, the tool ignores minor fluctuations and focuses on significant structural shifts in price.
3. Automatic Trend Detection Once the script identifies multiple potential highs and lows, it determines the direction of the most recent trend:
- If a major high occurred before a major low, it recognizes a downward movement.
- If a major low occurred before a major high, it recognizes an upward movement.
The script then automatically anchors the Fibonacci tool to these two points, ensuring the retracement levels are oriented correctly according to the current market flow.
4. Visual Output and Levels After calculating the start and end points of the trend, the tool draws a complete Fibonacci suite on your chart. It includes a comprehensive set of standard and extended levels, such as:
- Core Retracements: 23.6%, 38.2%, 50.0%, 61.8%, and 76.4%.
- Extended Levels: It also plots deeper retracements (like 123.6% and 161.8%) and significant extension targets (up to 261.8%).
This automation removes the manual guesswork of trying to "eyeball" where a trend started or ended, providing you with a consistent, rule-based visual of potential support and resistance zones.
//+------------------------------------------------------------------+
//|                                                         Fibo.mq4 |
//|                                                        Don Perry |
//|                                                www.fxAdvisor.com |
//+------------------------------------------------------------------+
#property copyright "Don Perry"
#property link      "donperry1[@t]gmail.com"

#property indicator_chart_window
//+------------------------------------------------------------------+
//| Custom indicator initialization function                         |
//+------------------------------------------------------------------+
int init()
  {
//---- indicators
//----
   return(0);
  }
//+------------------------------------------------------------------+
//| Custom indicator deinitialization function                       |
//+------------------------------------------------------------------+
int deinit()
  {
//----
   ObjectDelete("Fibo");
//----
   return(0);
  }
//+------------------------------------------------------------------+
//| Custom indicator iteration function                              |
//+------------------------------------------------------------------+
extern int lookback = 24;
extern int lastbar = 0;
extern color FibColor= Green;
int start()
  {
  ObjectDelete("Fibo");
   int    counted_bars=IndicatorCounted();
//----
   double lowest=1000, highest=0;
   datetime T1,T2;
   for(int i=lookback+lastbar;i>lastbar+1;i--)
   {
      double curLow0=iLow(Symbol(),Period(),i-2);
      double curLow1=iLow(Symbol(),Period(),i+1);
      double curLow2=iLow(Symbol(),Period(),i);
      double curLow3=iLow(Symbol(),Period(),i-1);
      double curLow4=iLow(Symbol(),Period(),i-2);

       double curHigh0=iHigh(Symbol(),Period(),i+2);
       double curHigh1=iHigh(Symbol(),Period(),i+1);
        double curHigh2=iHigh(Symbol(),Period(),i);
         double curHigh3=iHigh(Symbol(),Period(),i-1);
         double curHigh4=iHigh(Symbol(),Period(),i-2);

      if(curLow2<=curLow1 && curLow2<=curLow1 && curLow2<=curLow0 )
      {
      if(lowest>curLow2){
         lowest=curLow2;
         T2=iTime(Symbol(),Period(),i);}
      }

      if(curHigh2>=curHigh1 && curHigh2>=curHigh3&& curHigh2>=curHigh4)
      {
         if(highest<curHigh2){
         highest=curHigh2;
         T1=iTime(Symbol(),Period(),i);}
      }


   }


   Comment(highest, lowest);
   if(T1<T2)
   {ObjectCreate("Fibo", OBJ_FIBO, 0, T1, highest,T2,lowest);}
   else{
    ObjectCreate("Fibo", OBJ_FIBO, 0, T2, lowest, T1,highest);
   }
//----

string fiboobjname = "Fibo";
ObjectSet(fiboobjname, OBJPROP_FIBOLEVELS, 11);
     ObjectSet(fiboobjname, OBJPROP_FIRSTLEVEL, 0.0);
   ObjectSetFiboDescription(fiboobjname,0,"Low    %$");
   ObjectSet(fiboobjname, OBJPROP_FIRSTLEVEL+1, 0.236);
   ObjectSetFiboDescription(fiboobjname,1,"23.6     %$");
   ObjectSet(fiboobjname, OBJPROP_FIRSTLEVEL+2, 0.382);
   ObjectSetFiboDescription(fiboobjname,2,"38.2     %$");
   ObjectSet(fiboobjname, OBJPROP_FIRSTLEVEL+3, 0.50);
   ObjectSetFiboDescription(fiboobjname,3,"50.0     %$");
   ObjectSet(fiboobjname, OBJPROP_FIRSTLEVEL+4, 0.618);
   ObjectSetFiboDescription(fiboobjname,4,"61.8     %$");
   ObjectSet(fiboobjname, OBJPROP_FIRSTLEVEL+5, 0.764);
   ObjectSetFiboDescription(fiboobjname,5,"76.4     %$");
   ObjectSet(fiboobjname, OBJPROP_FIRSTLEVEL+6, 1.000);
   ObjectSetFiboDescription(fiboobjname,6,"High    %$");
   ObjectSet(fiboobjname, OBJPROP_FIRSTLEVEL+7, -0.236);
   ObjectSetFiboDescription(fiboobjname,7,"123.6     %$");
   ObjectSet(fiboobjname, OBJPROP_FIRSTLEVEL+8, -0.382);
   ObjectSetFiboDescription(fiboobjname,8,"138.2     %$");
   ObjectSet(fiboobjname, OBJPROP_FIRSTLEVEL+9, -0.50);
      ObjectSetFiboDescription(fiboobjname,9,"150.0     %$");
   ObjectSet(fiboobjname, OBJPROP_FIRSTLEVEL+10, -0.618);
   ObjectSetFiboDescription(fiboobjname,10,"161.8     %$");
   ObjectSet(fiboobjname, OBJPROP_FIRSTLEVEL+11, 2.000);
   ObjectSetFiboDescription(fiboobjname,11,"200.0     %$");
   ObjectSet(fiboobjname, OBJPROP_FIRSTLEVEL+12, 2.618);
   ObjectSetFiboDescription(fiboobjname,12,"261.8     %$");
   ObjectSet( "Fibo", OBJPROP_LEVELCOLOR, FibColor) ;
   ObjectsRedraw();
   return(0);
  }
//+------------------------------------------------------------------+
Comments